
Mapping of anthropogenic stress in vegetation and soil
Techniques of acquisition, processing and interpretation of multispectral data related to key environmental processes such as chlorophylline photosynthesis and plant nutrition, have been refined, especially in relation to the identification and mapping of anthropogenic stress caused by soil infiltration or dispersion of polluting material on the surface. Recent research suggests that there is a distinction recognizable by data acquired through multispectral relief, between natural stress due to, for example, drought and an induced or anthropogenic stress due to soil contamination: this difference is visible in a different physiological response of plants (Zinnert and others, 2012).
A series of computations between multispectral bands, known as vegetation indices, have been developed and applied in agronomy and environmental sciences to optimize information from multispectral data, which has an increasing geometric, spectral, radiometric and temporal resolution since new acquisition technologies such as RPAS and new sensors have seen significant technological development over the last decades (Thenkabail, 2000).
For environmental and agronomic applications, the bands most involved in the calculations are Red (630 nm to 690 nm), Red Edge (705 nm to 745 nm), NIR (750 nm to 950 nm), Green (525 nm to 575 nm) and Violet (390 nm to 450 nm). The main vegetation indices are the Normalized Differentiation Vegetation Index (NDVI) and its optimizations or transformations such as the Green Normalized Differentiation Vegetation Index (GNDVI), Soil Adjusted Vegetation Index (SAVI) and also in this case including its optimizations such as the TSAVI (Transformed Soil Adjusted Vegetation Index) or the Modified Soil Adjusted Vegetation Index (MSAVI). A very important index for evaluating water content and quality in vegetation and soil is NDWI (Normalized Difference Water Index). By applying the multispectral survey to environmental monitoring of soil matrix or vegetation matrix, these indices are useful for defining growth rates and the vegetative quality of leafy vegetation.
The study of one of these spectral bands, the Red Edge, allows specifically to classify vegetation contaminated by presence in the soil by inflow or gaseous hydrocarbon suspension.
To apply this method of analysis, it is necessary to first correctly classify the vegetation present on the soil and evaluate the moisture content, the species present, the vegetation cover, the leaf cover index, and the surface temperature in different lighting stages and in different seasons. Vegetation growing in soil contaminated by hydrocarbons has visible damages in the Red Edge band, which is the name given to the sudden change in the spectrum region ranging from 680 nm to 730 nm and is caused by a combined effect of a strong incident radiation absorption and strong inner reflection and scattering of the leaf called “leaf internal scattering”.
The shift in the Red Edge reflection of vegetation, which indicates a reduction in plant health or a stress condition linked to anthropogenic contamination, has long been studied and applied to the agronomic and environmental study of cultivated or vegetated areas.
Important tests in this field were carried out by our R&D team on a soil with heavy hydrocarbon contamination: applied remote sensing outputs that were compared in GIS environments were the multi-spectral orthophoto of the 8 bands of MAIA WV, one thermal orthophoto obtained with high resolution thermal camera and an RGB orthophoto always obtained with MAIA’s RGB sensor. With regard to site investigations in collaboration with environmental engineers to which these products serve as mapping basis for macro-assessment of contamination problems, it was possible to identify and map vegetal anomalies related to the presence of hydrocarbons in the soil, also found in a variation in surface temperature, as well as in a different reflection in the NIR band and, as previously mentioned, particularly in the Red Edge band, and in some indexes.


The field activity is supported by valid scientific publications (Noomen, 2003 & 2008), in which the high-quality method is certified and in which there is evidence of high susceptibility of crops in the presence of gaseous hydrocarbons deposited on the ground or surface stagnation, and more specifically in the presence of Ethane gas (C2H6): cultures exposed to this gas are more spectrally reflected in bandwidths ranging from 570 nm to 700 nm (Noomen 2008).
Thanks to the multispectral survey made with MAIA WV, it is also possible to detect an accentuated concentration of metals in the soil matrix. Wu et al. (2007) demonstrated that spectroscopy in visible and near infrared regions has a strong negative correlation with certain metals (Cadmium, Chrome, Copper, Mercury, Lead, Zinc) in contaminated soils, depending on the presence iron oxide and carbon content. Chloe et al. (2008) and Wu et al. (2008) continued fruitful research on the use of multispectral remote sensing to diagnose the presence of high concentrations of certain metals in contaminated soils.
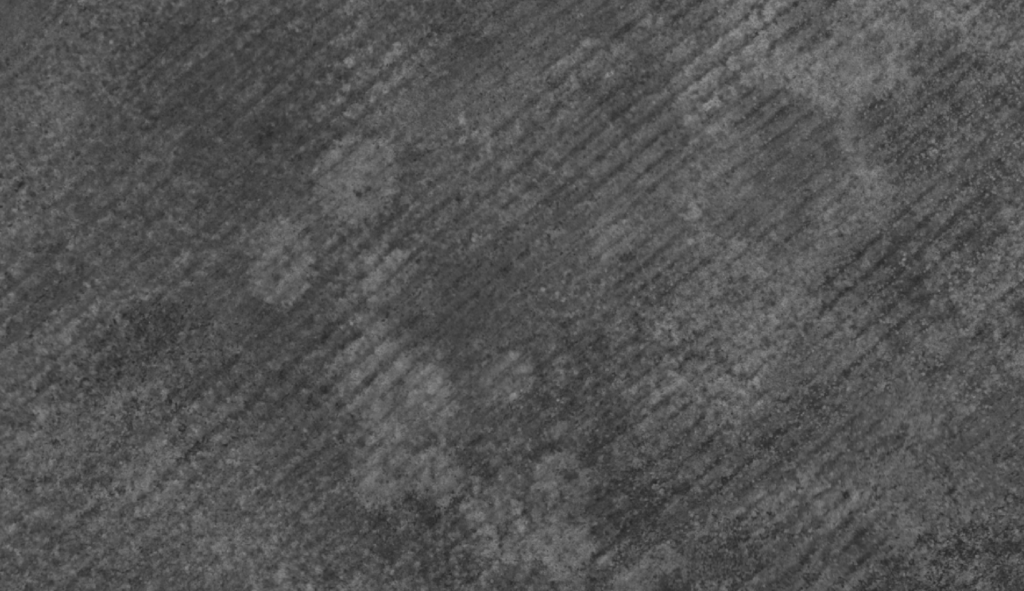
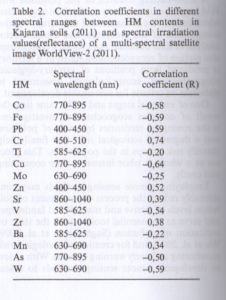
Other scientific studies (Asmaryan et al 2014) confirm the positive correlations between the presence of chromium, lead and zinc measured in the site and detected by multispectral survey, on non-vegetated soil (whose NDVI index by definition goes from 0 to 0.3). The same studies have identified specific reflectance values at certain wavelengths of certain metals in the soil matrix, as shown in the table.
Concerning the multispectral knowledge of the ground matrix, MAIA WV images, related to the wavelength ranges of satellites investigating the spectrum from visible to infrared such as Landsat TM, World-View 2 and Sentinel-2, can be processed to locate and map a large set of minerals, including iron oxides, clays, and other hydroxyl minerals that are often in nature at hydrothermal alterations in the outcrops (Source: Andrea G. Fabbri, Gabor Gaál, Richard B. McCammon, Deployment and Geoenvironmental Models for Resource Exploitation and Environmental Security, Springer Science & Business Media, 2012).