Multispectral survey for precision viticulture
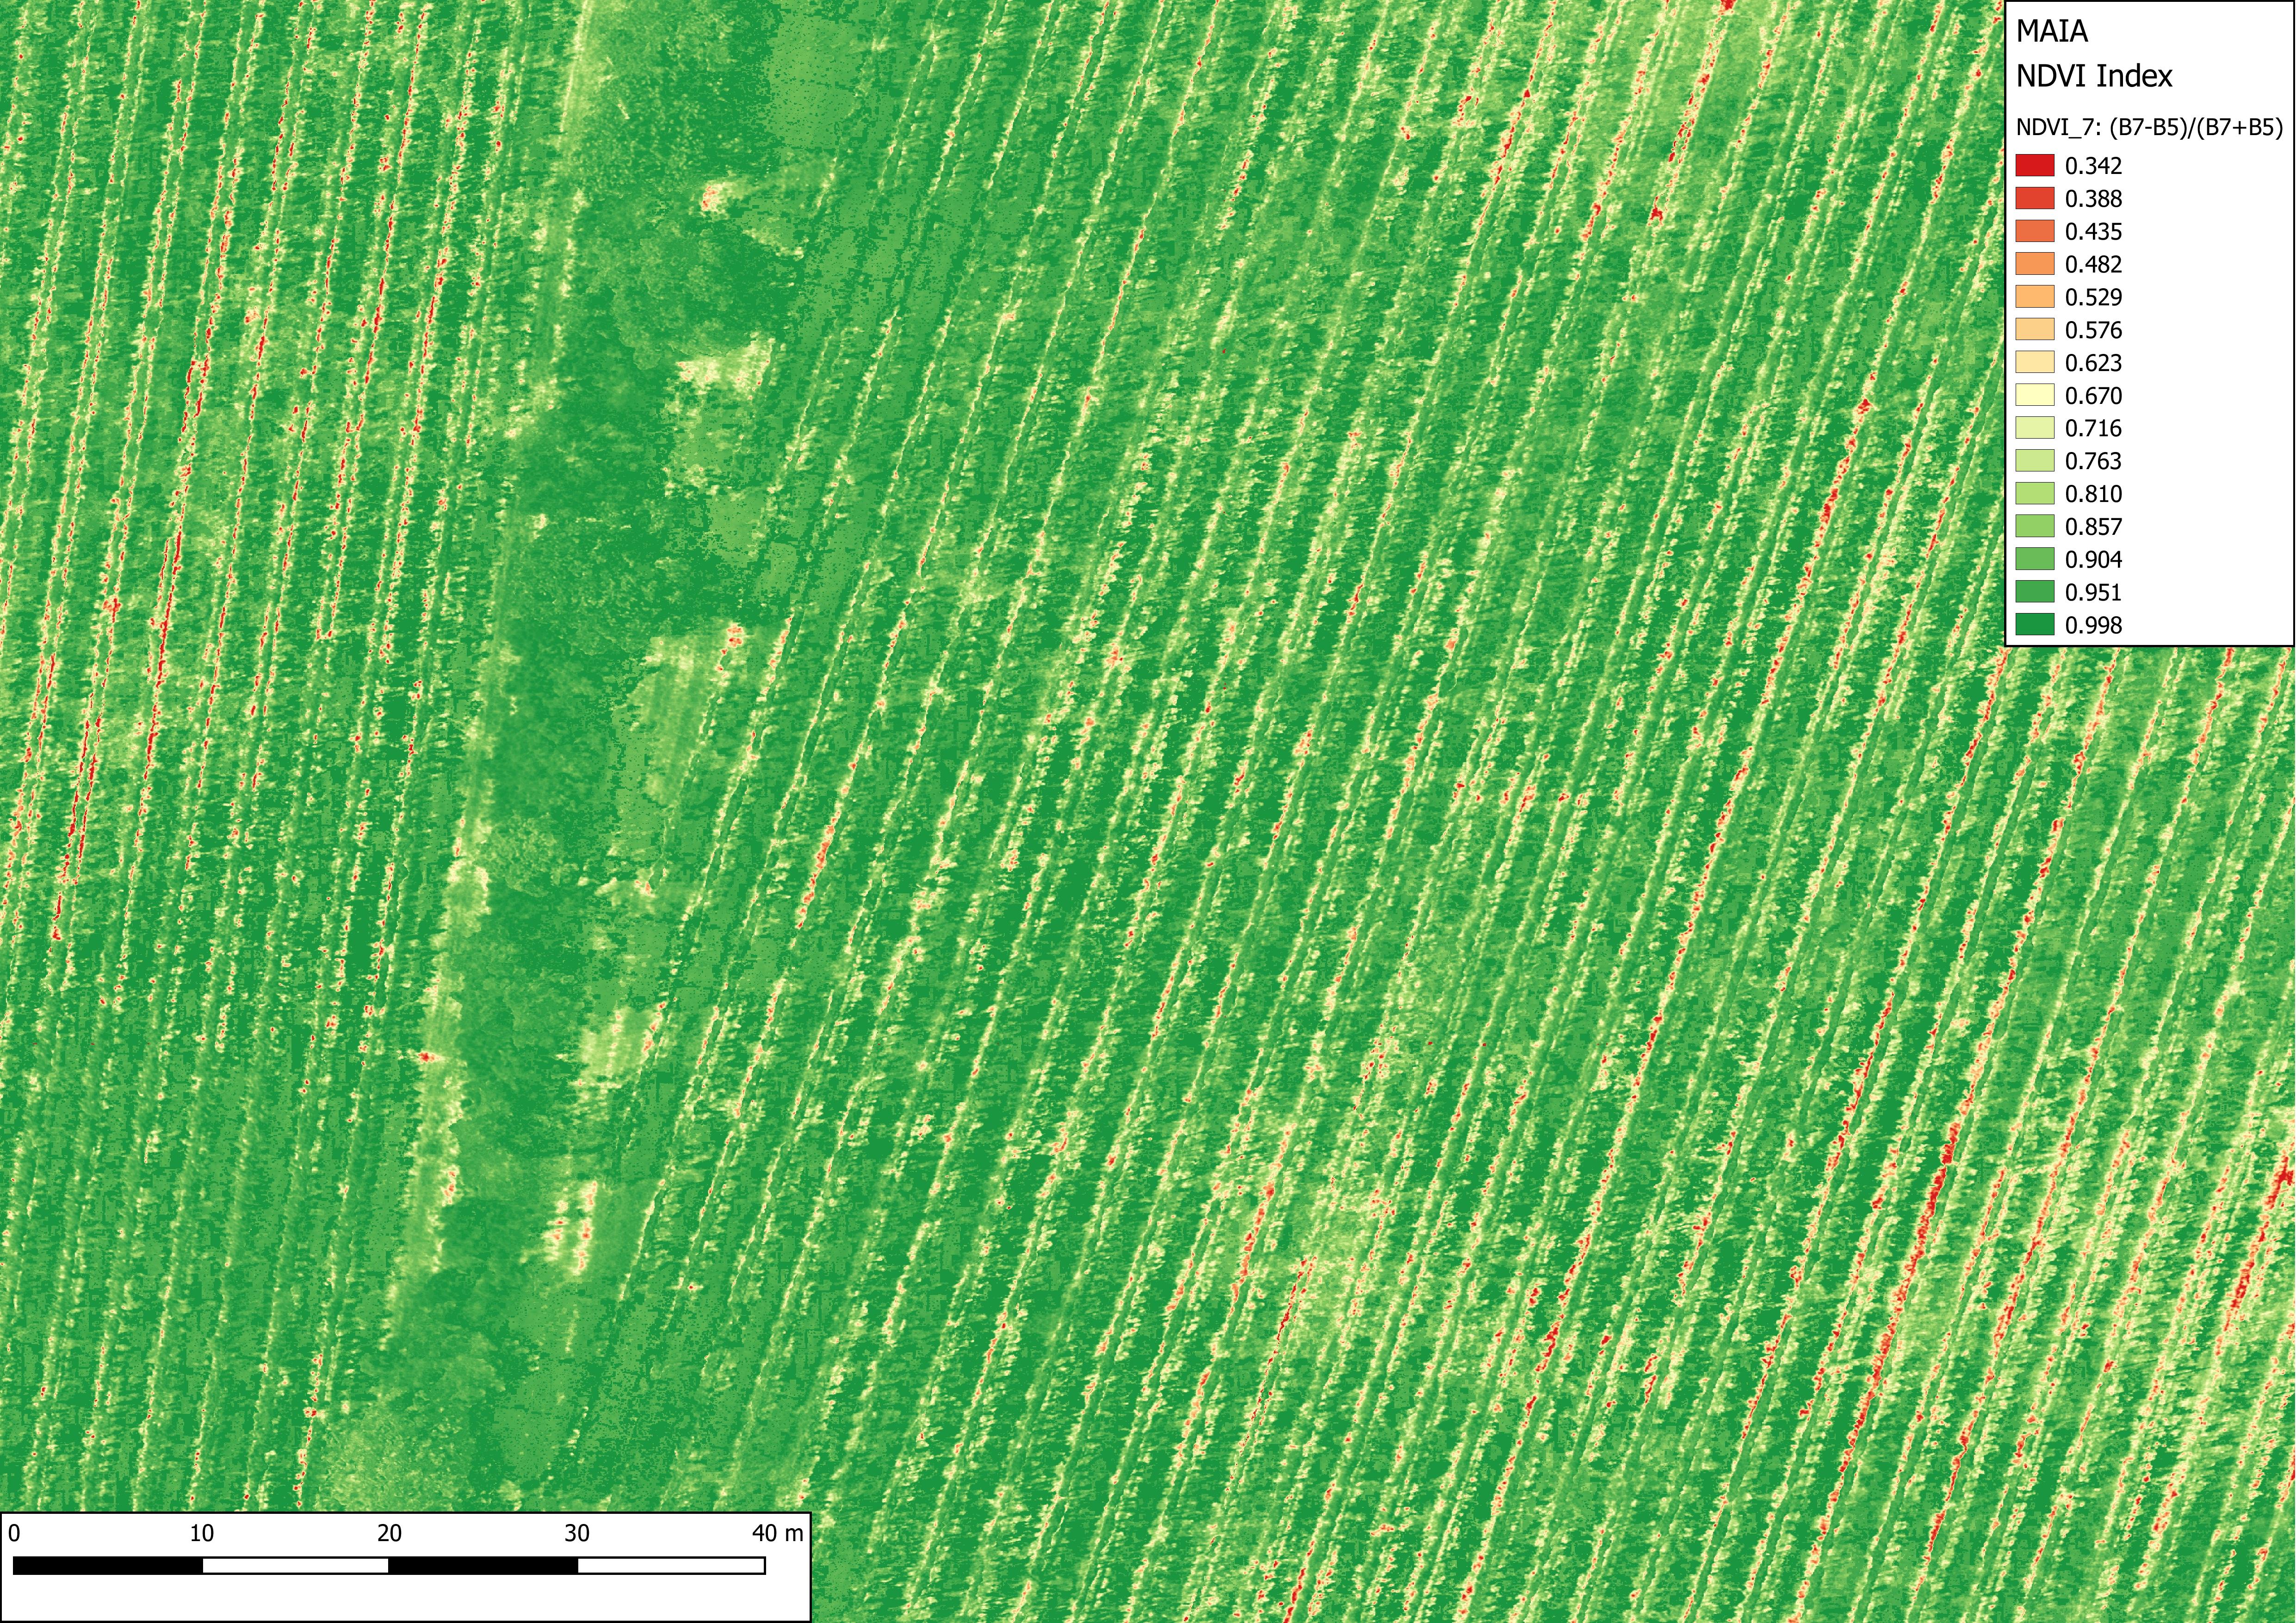
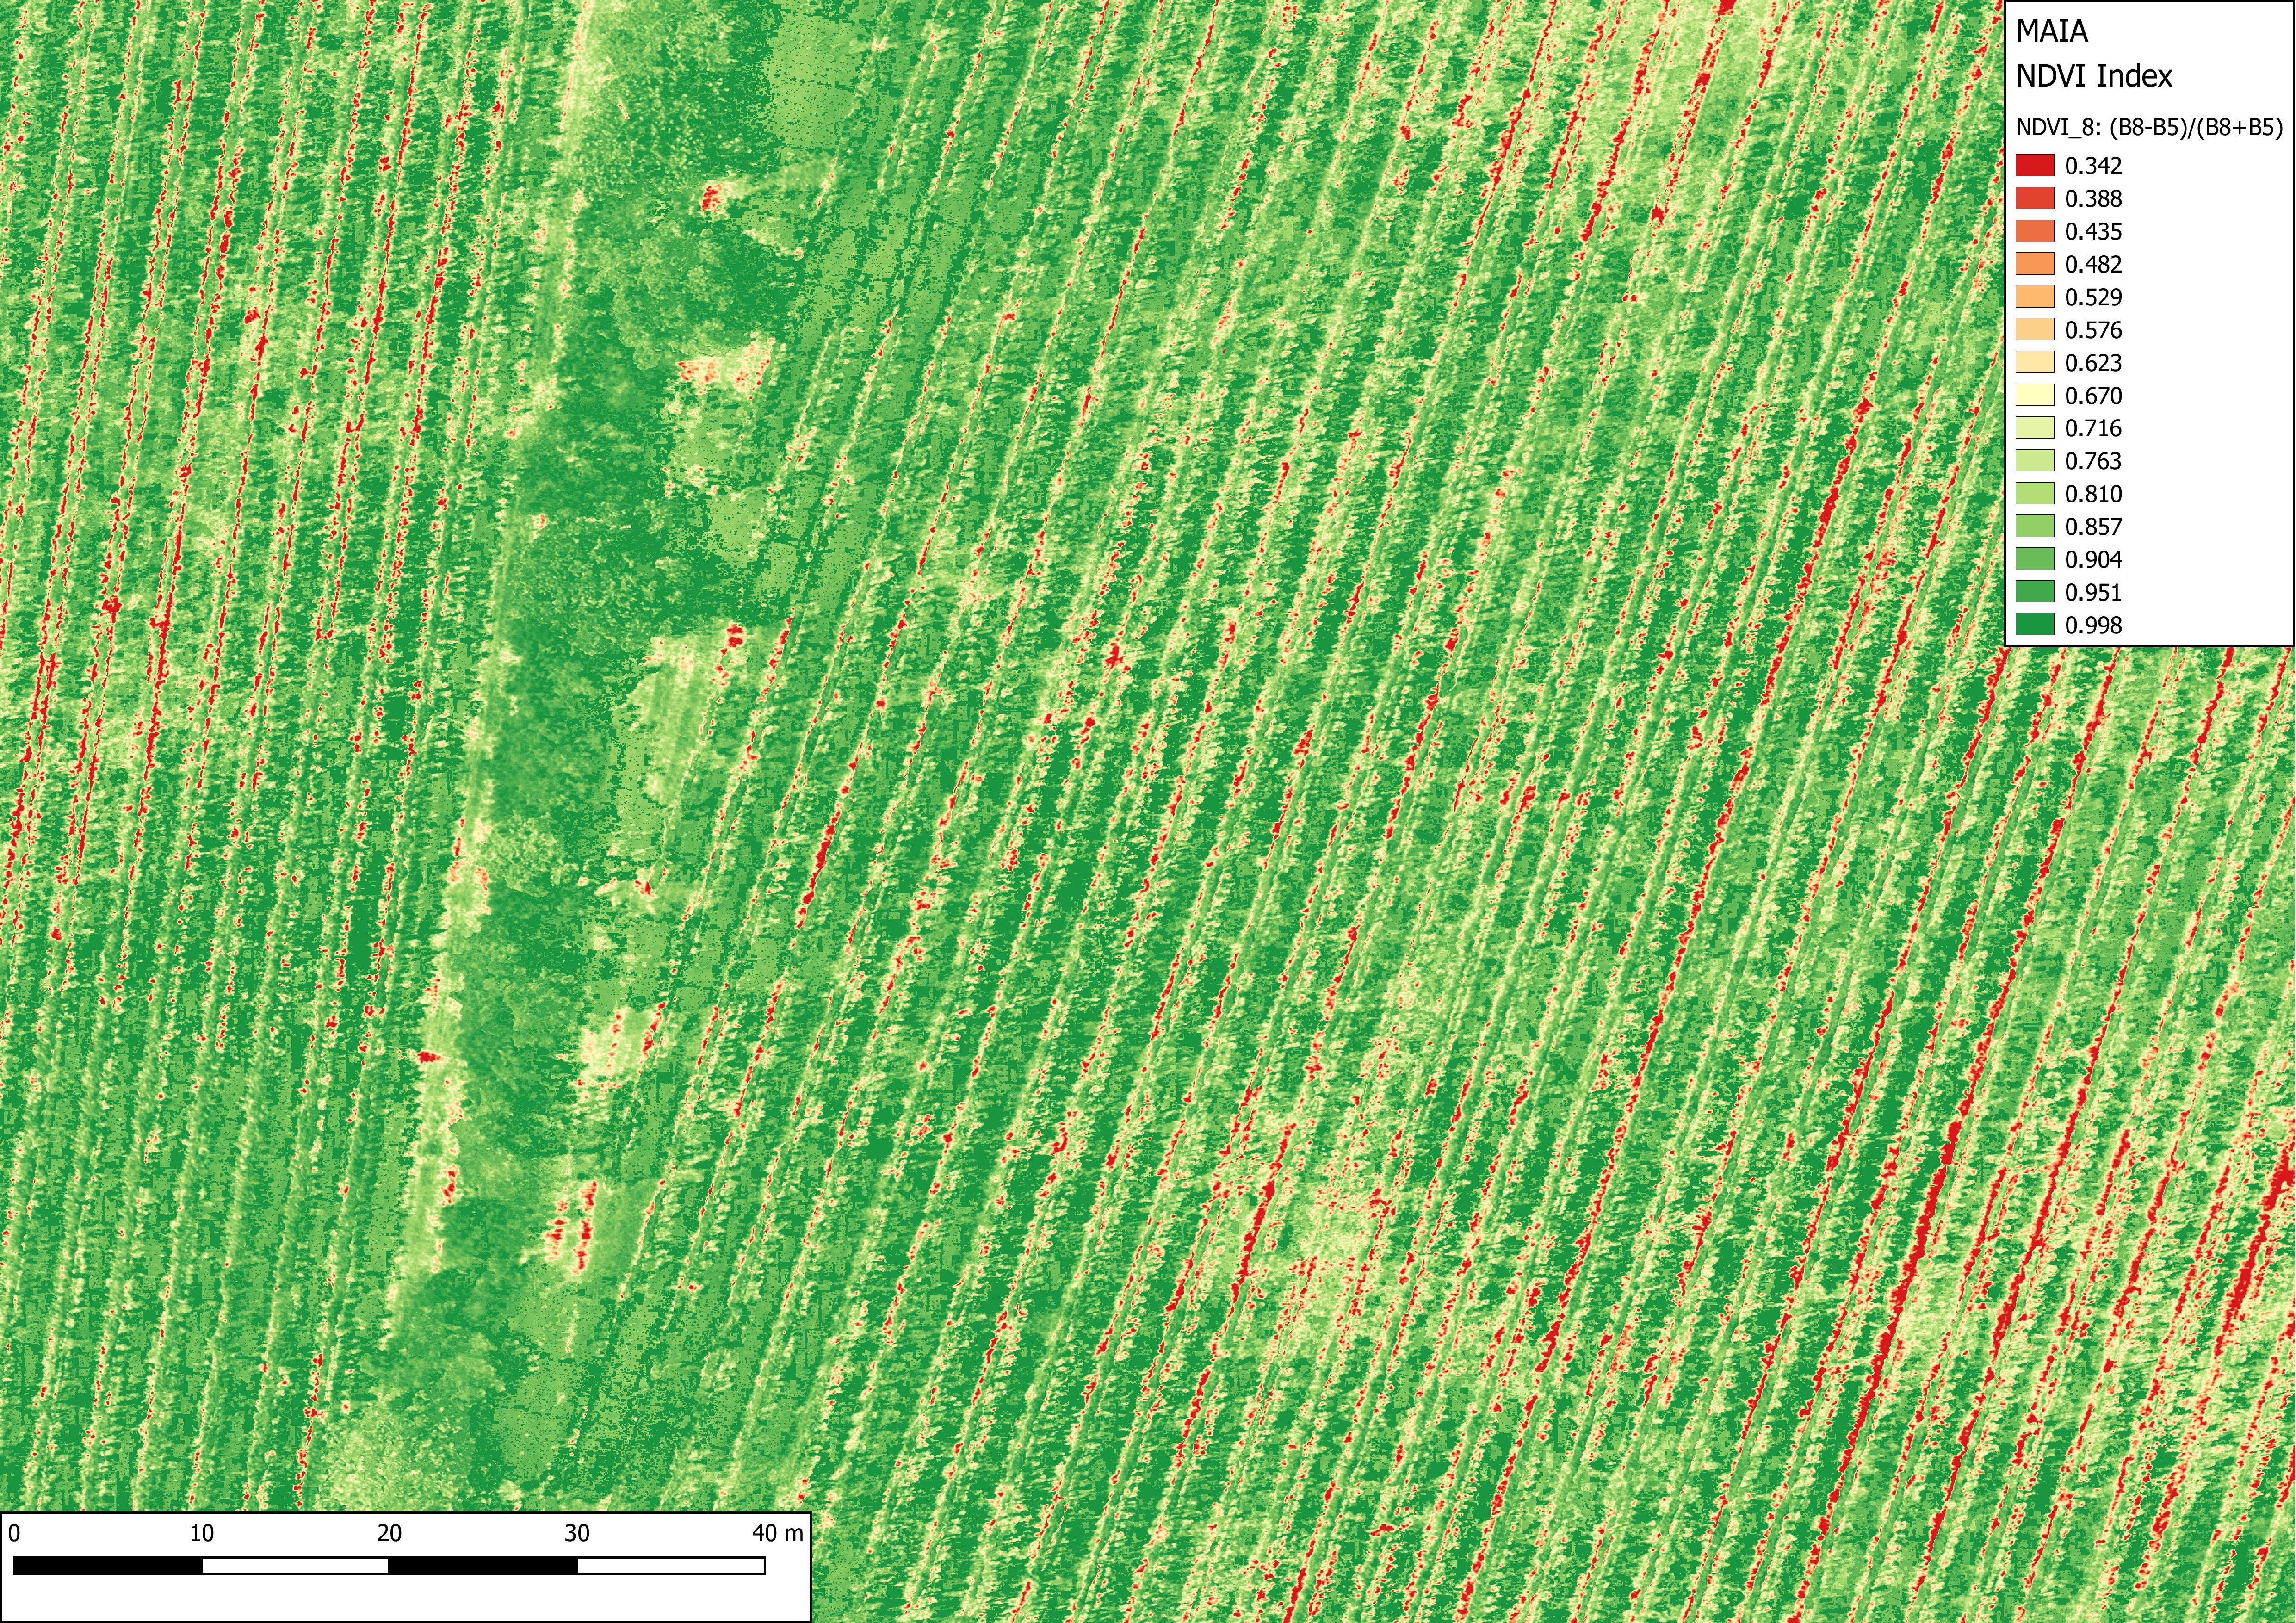
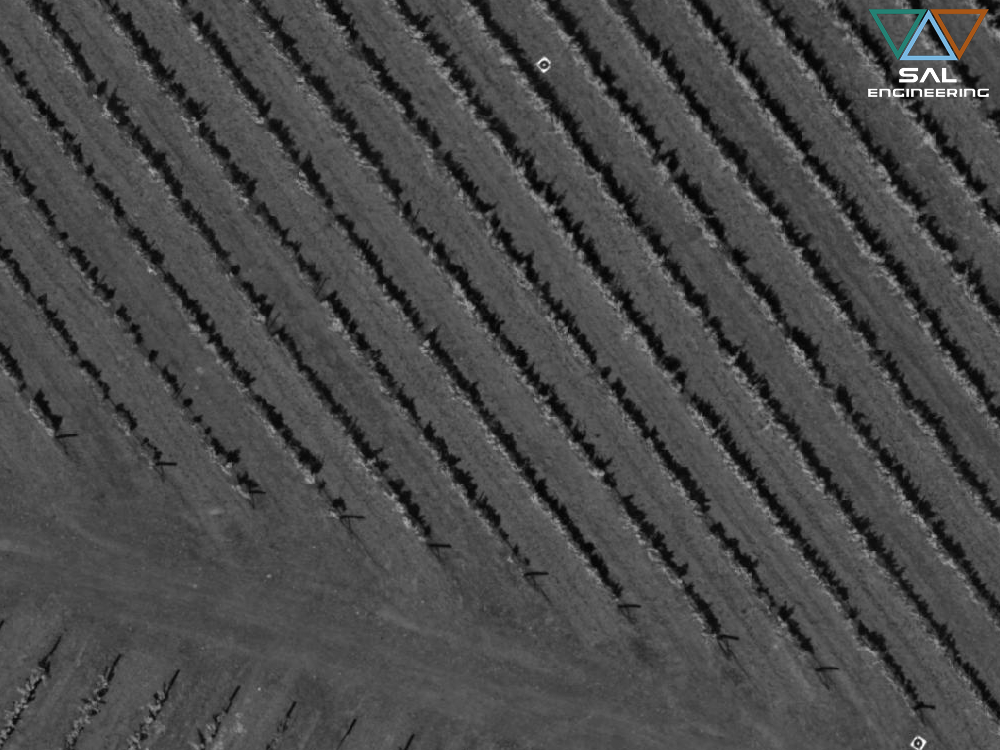
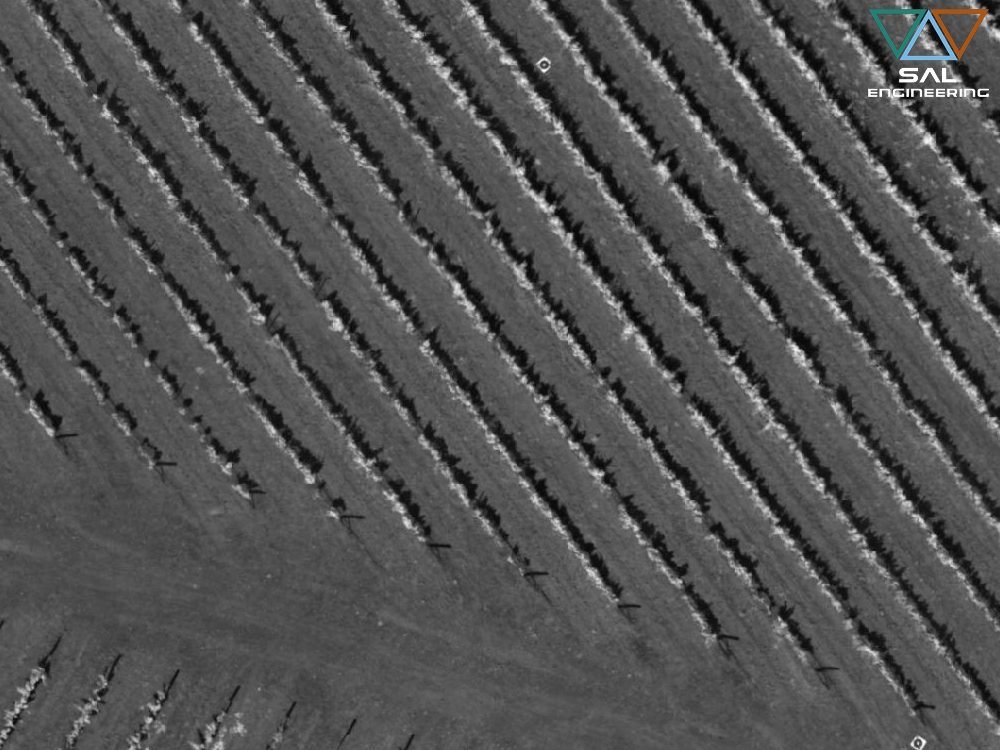
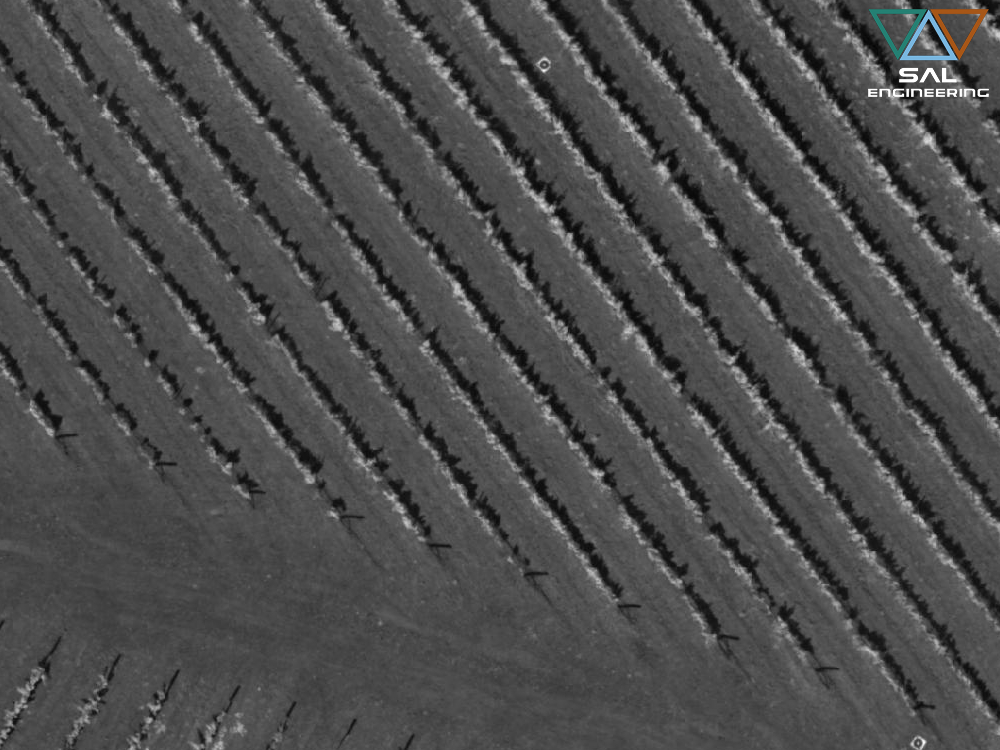
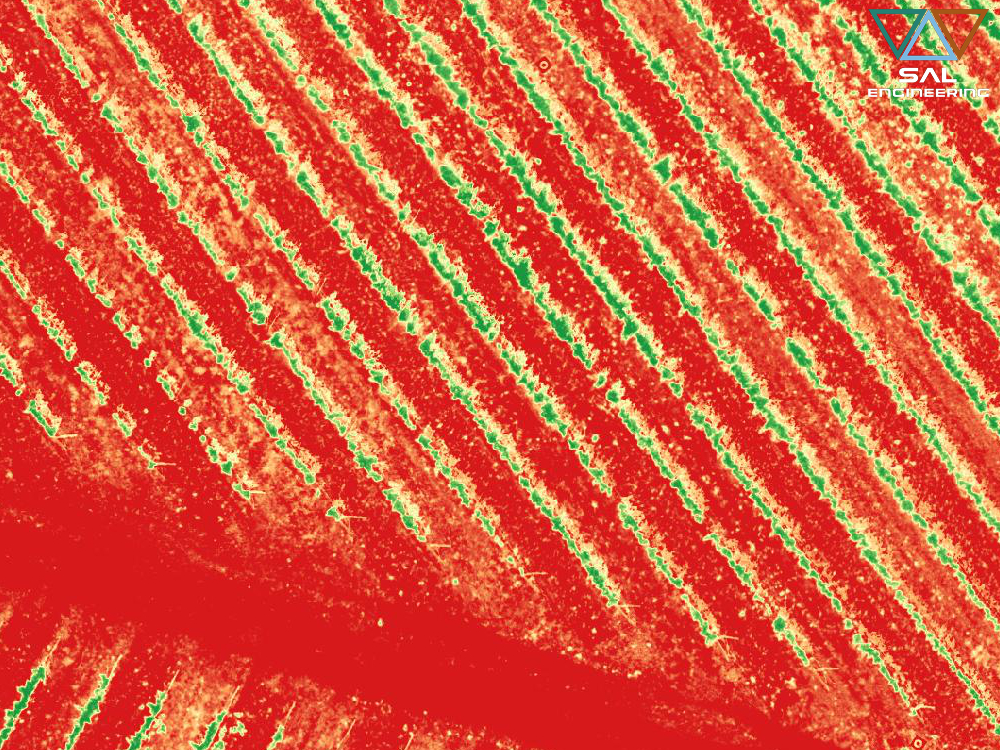
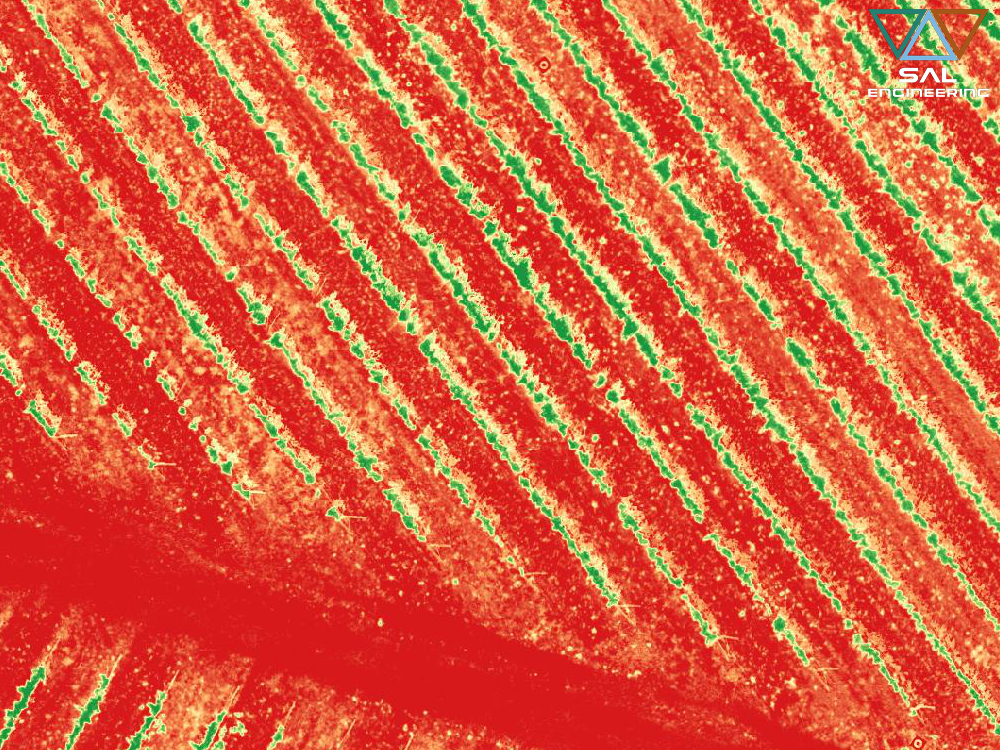
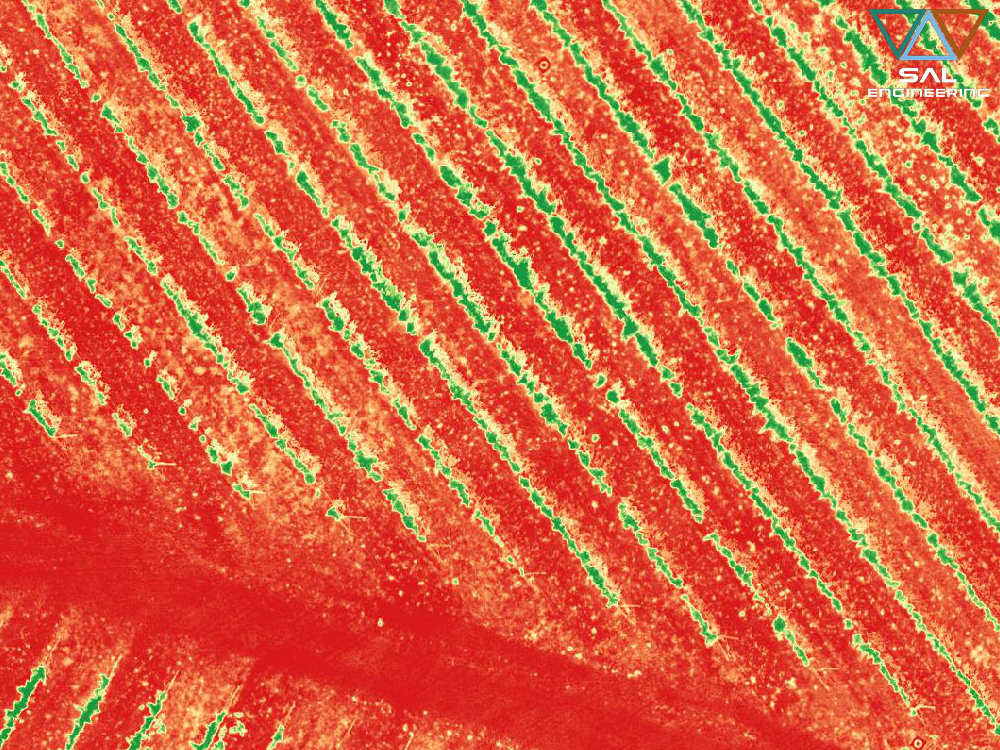
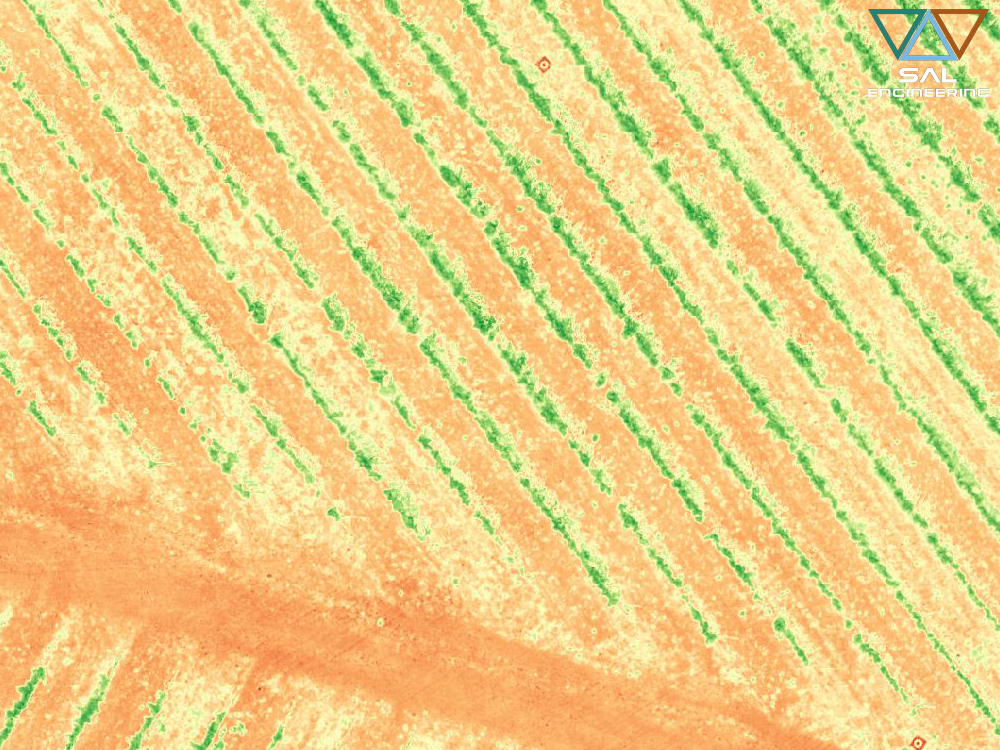
In Tenuta Dodici, Massa Marittima (Grosseto), Italy, SAL Engineering conducted a multispectral survey with MAIA, aimed to create a multispectral orthophoto with 8 different spectral bands. We generate orthophoto in Coastal, Blue, Green, Red, Red Edge, NIR1 and NIR2 band, and we give these products to the agronomists for different kind of use. Here below you can view the bands used for evaluating the vegetation health status after particular treatments on soil and vineyards:
The vineyards present high variability in their biophysical properties, and the many factors that define them can be classified as “static”, such as climate and some properties that describe soil properties (eg weaving, pH, carbonate content, depth, etc …), and “dynamic”, such as the thermal and water values of the soil, the nutrient content and the annual climatic trend. From this, it is clear that the fundamental question on achieving predetermined results is the need to measure the variability.
Today’s viticulture agronomy has to deal with soil management, irrigation, pruning, fertilization, plant protection and harvesting with procedures not only designed and implemented for whole vineyards but also for individual portions within the same vineyard. In viticulture, especially in the hilly area, it frequently occurs that within the same vineyard there are areas characterized by composition, soil structure, presence of humidity, lighting and different microclimate: for these disomogeneities the vine responds accordingly, highlighting particular states of physiological expression. Monitoring vegetative health is a great advantage for small-medium farms to enhance qualitative differences, differentiated agronomic management, and traceability of the product. On the other hand, for larger companies, production estimates are important for the evaluation of grape harvesting, for treatment management, and for traceability of the supply chain.
Vegetative health is the most obvious of these responses. Knowing the health status, vigor, and physiological needs of vines belonging to different vineyard areas will surely help the agronomist to put in place the most appropriate procedures and treatments to ensure a quality harvest. And the first step towards in-depth knowledge of your vineyard is monitoring with multispectral survey techniques to constantly investigate the state of health of the crop. Remote sensing is the set of techniques and methodologies for capturing and interpreting objects and phenomena data based on emitted, reflected and transmitted electromagnetic energy that interact with the surfaces of interest. The percentage of the radiant energy flow incident on a body that is reflected, defined as spectral reflection, is a function of the geometric characteristics and the physical-chemical composition of the body itself, with the consequence that certain objects or surfaces are recognizable in the different bands, for its characteristic spectral signature. It is possible to identify the spectral signature of different substances in specific spectral bands and above all the different types of vegetation in different evolutionary and health states. For example, water tends to lower the reflection of the bodies that contain it, while chlorophyll content proportionally determines the absorption of radiation in the spectral range of red and a high reflection in the near infrared interval.
Airplanes and drones are specially designed to accommodate the multispectral and hyperspectral sensors in their gimbal, in order to carry out the survey with rigorous acquisition procedures, considering the calibration of the sensor according to the light conditions in the moment of the relief, and planning a proper geometry of acquisition. Fundamental in this respect is the integration between the acquisition system, the inertial platform of the aircraft and the Global Navigation Satellite System (GNSS), which enable you to obtain the orientation and position in the space of images captured on the various spectral bands, which allow the flight through photogrammetric overlays.
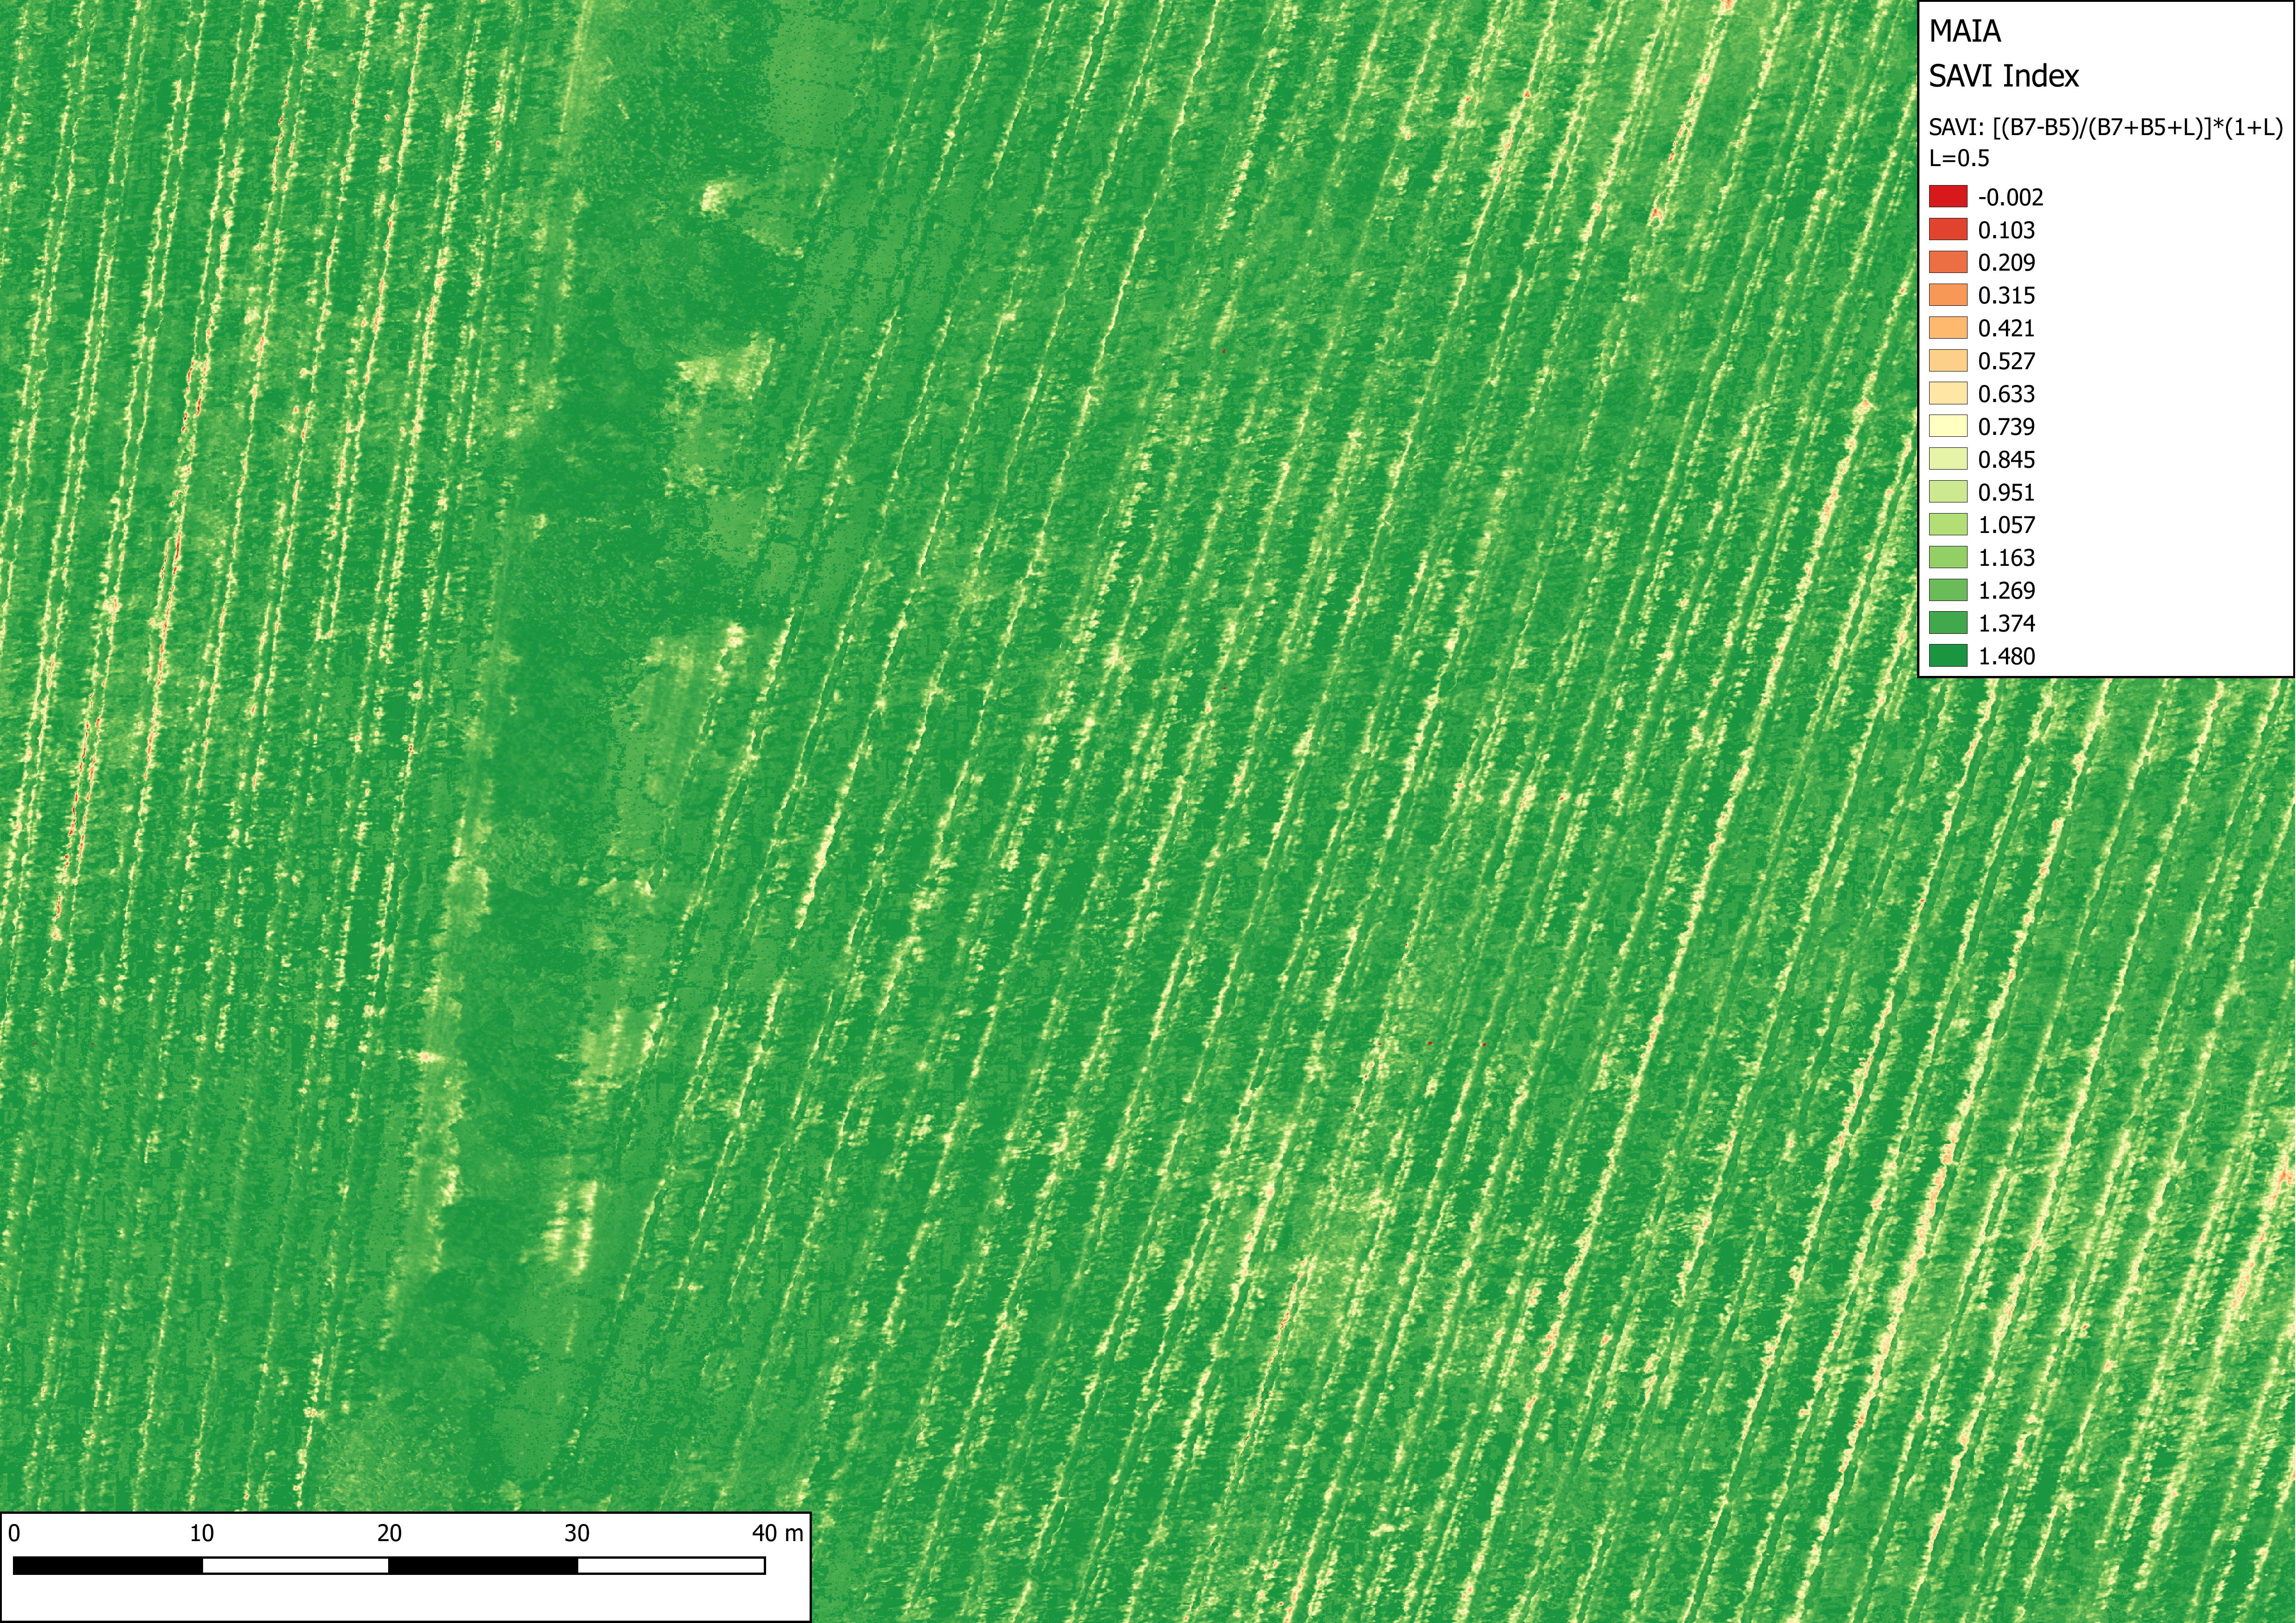
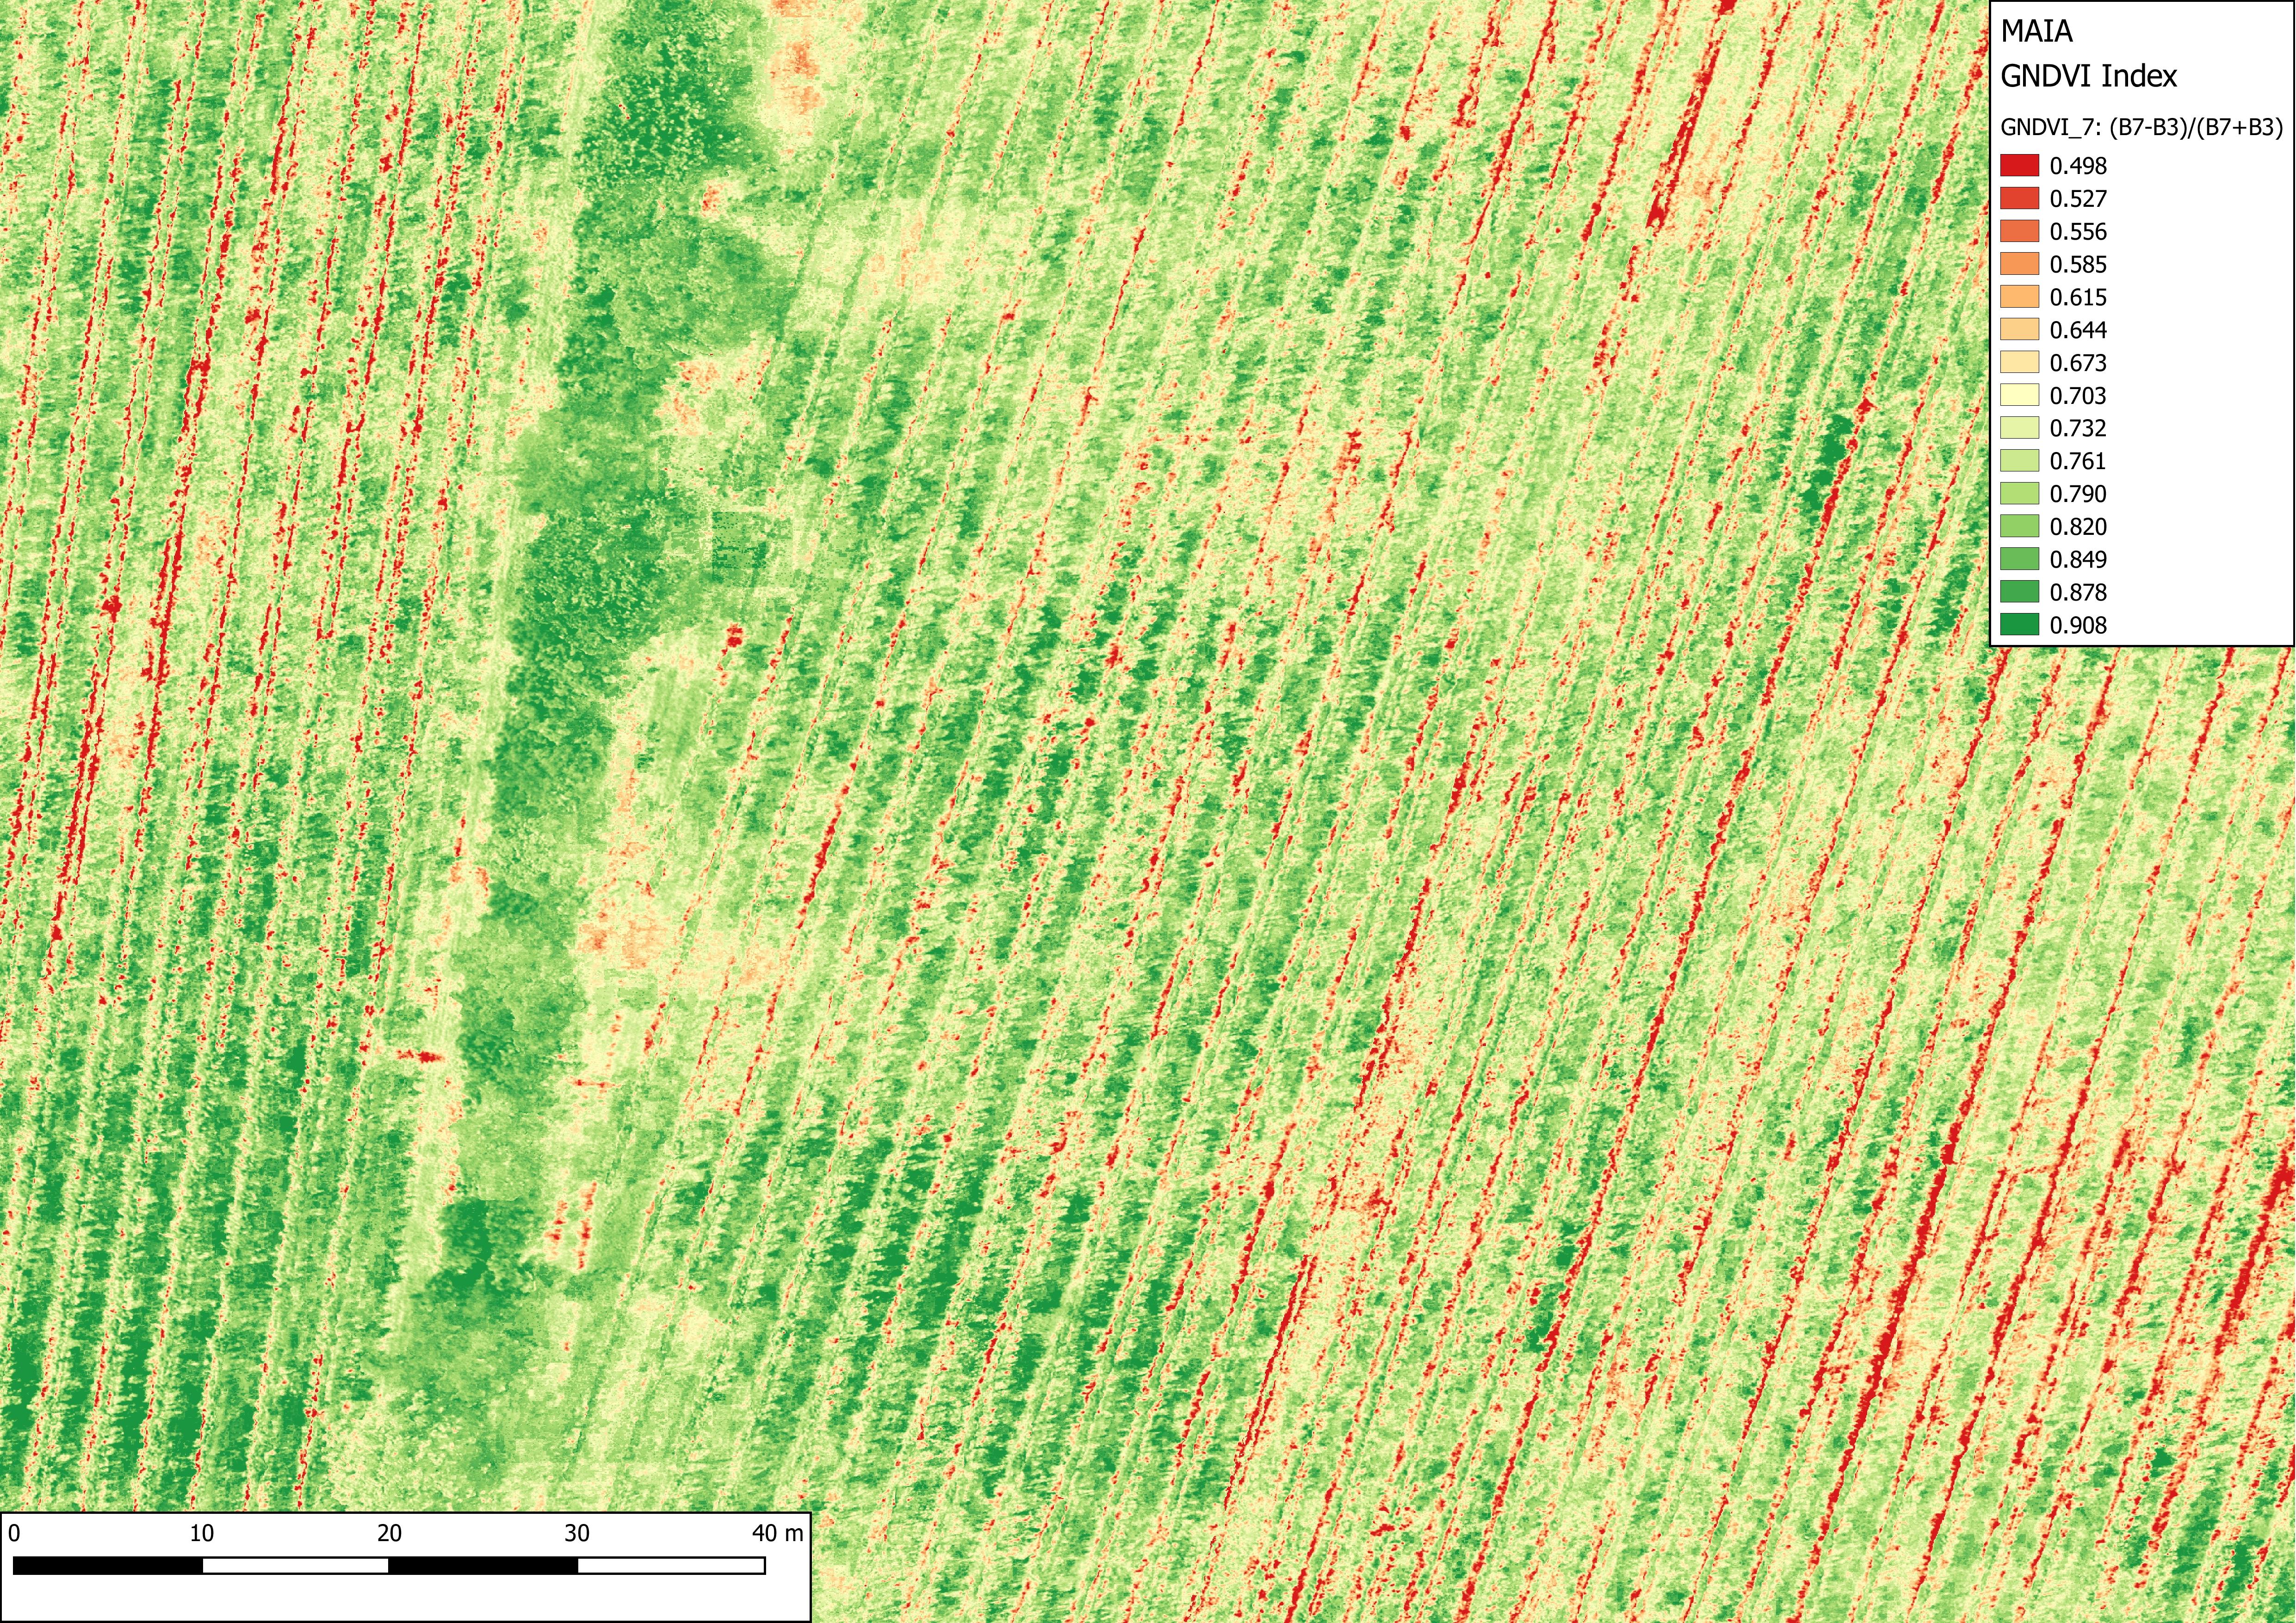
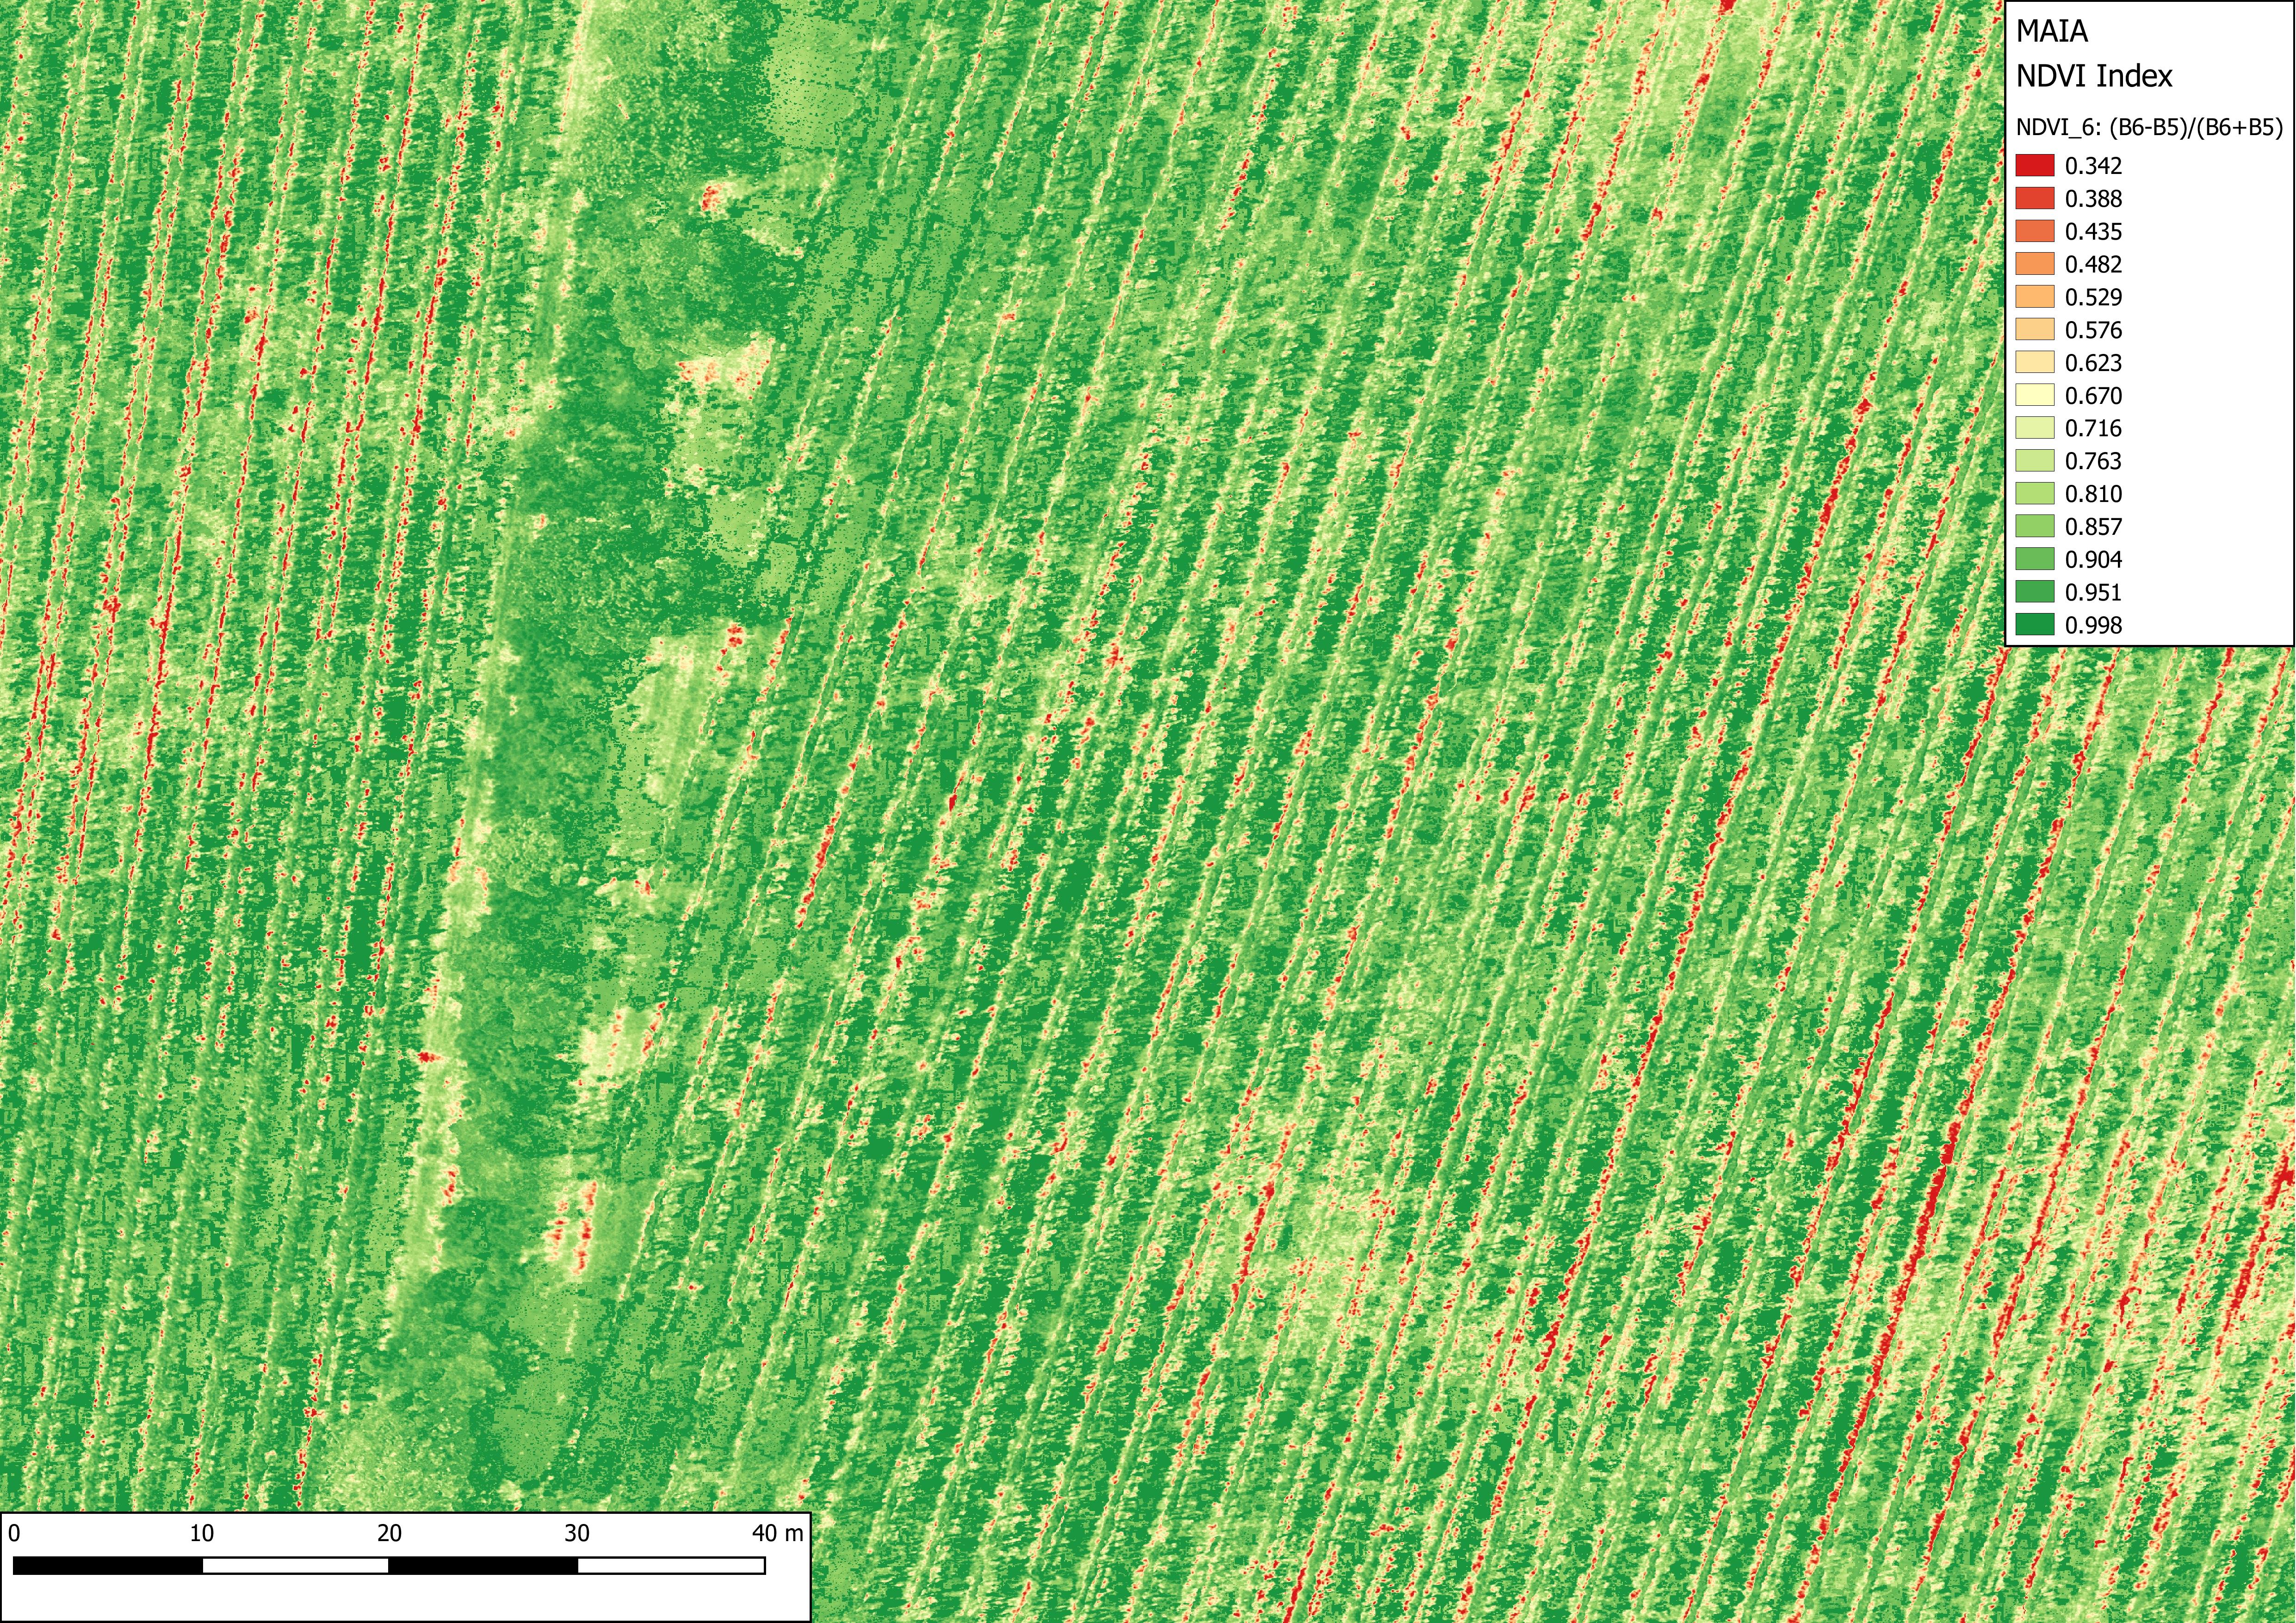
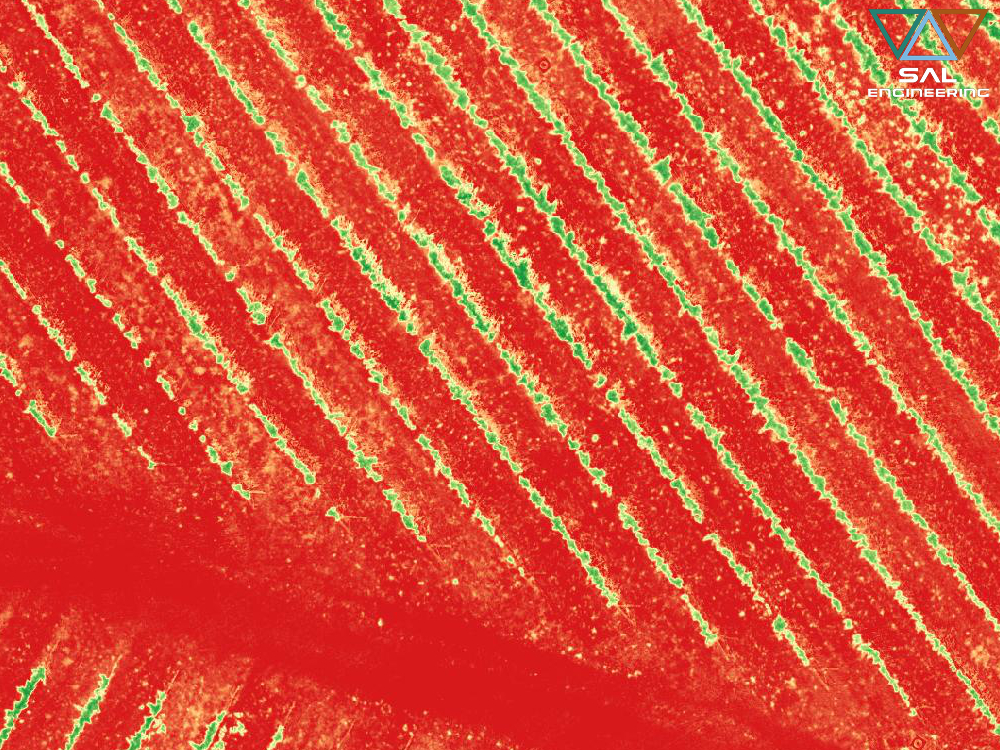
The multispectral orthophoto is the preliminary product, derived from the creation of the georeferenced 3D model of the area, fundamental for the creation of various indices to evaluate the health status of the vineyard vegetation and to decide then where to intervene with fertilizers, other products or agronomic treatments. From multispectral data, it is possible to obtain a series of indexes capable of describing precisely the characteristics of the vegetation present on the soil. Among these vegetation indices, the best known is the Normalized Difference Vegetation Index (NDVI), which is based on a normalized difference between the near and red infrared bands. As evidenced by countless studies, the NDVI proves very reliable in describing the magnitude of photosynthetic active biomass present on the investigated surface. The NDVI index is in fact correlated positively with the amount of plant biomass per unit of surface (LAI, leaf area index) and, therefore, the vigor of culture. The index assumes values between +1 and -1: in particular, from 0.1 to 0.3 we usually find a naked or slightly inert soil, while in the case of plant biomass there is an index higher than 0.5, and it increases to identify a different vegetative state of the plant, and an increasing production of chlorophyll. The contribution of specific vegetative indices to viticulture has been extensively studied and demonstrated, but it should be remembered that other interesting thematic maps for viticulturists can cover crop yields, acidity, sugars, polyphenols, anthocyanins, etc.
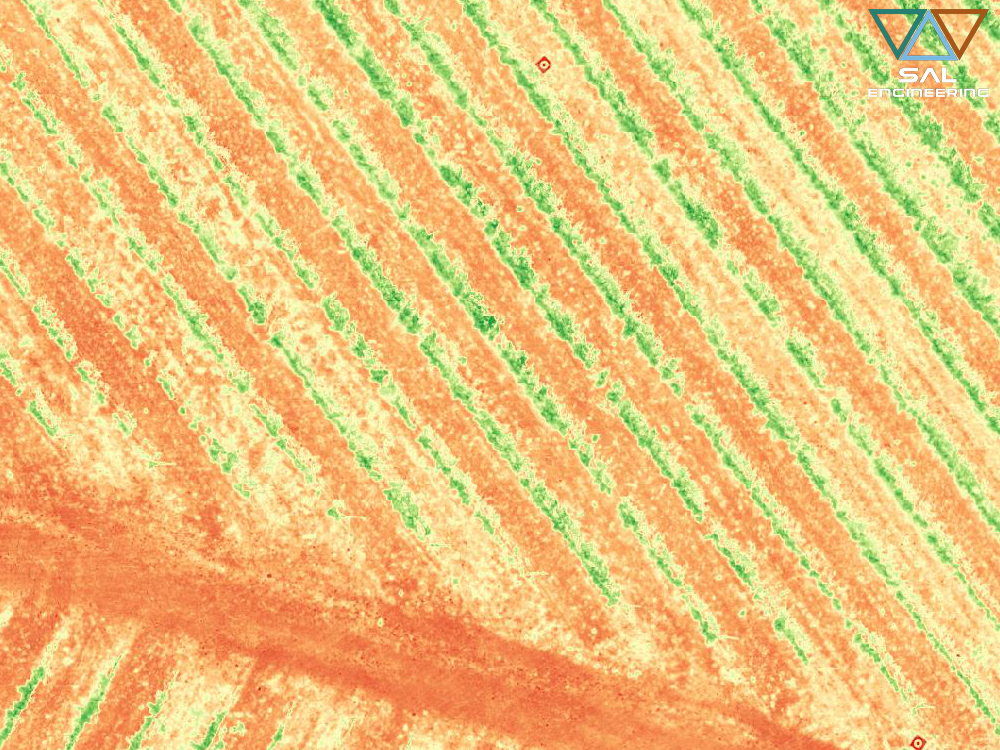
Here below you can view the same portion of vineyard in different indexes and views calculated on the raster products shown above:
The strategic goal of precision viticulture is to know the vineyard in the detail of the individual plant and to adapt cultivation techniques to its specific needs.
Once collected, data must be evaluated and interpreted through agronomic technical advice. GIS software for spatial data processing and analysis is currently used in professional practice and in viticulture research activities: vegetative health maps can be used to make picking choices in a vineyard or in a large area.
An ever-increasing integration of the collected data and an increasing accuracy and precision of the data that can be obtained allows:
-
a faster and more accurate plantation of new vineyards;
-
a reasoned and “environmentally friendly” management of the vineyard;
-
significant saving of time and material;
-
a reduction in intervention in the vineyard;
-
synergistic control of the vineyard-cellar chain;
-
improving the quality of grapes and wine;
-
operation and site-specific machining.
Vineyards present high variability in their biophysical properties, and the many factors that define them can be classified as “static”, such as climate and some properties that describe soil properties (eg weaving, pH, carbonate content, depth, etc …), and “dynamic”, such as the thermal and water values of the soil, the nutrient content and the annual climatic trend. From this, it is clear that the fundamental question on achieving predetermined results is the need to measure the variability.
Multispectral survey is the fundamental tool for having agronomic knowledge of the agricultural resource because it allows a series of comparisons between the vegetative health conditions of the crop:
-
in the different vegetative stages expected during the seasons;
-
before treatment for targeted intervention;
-
after treatment for an assessment of the consequences;
-
in different plots to understand different reactions to equal interventions;
-
in different seasons to monitor growth and health.
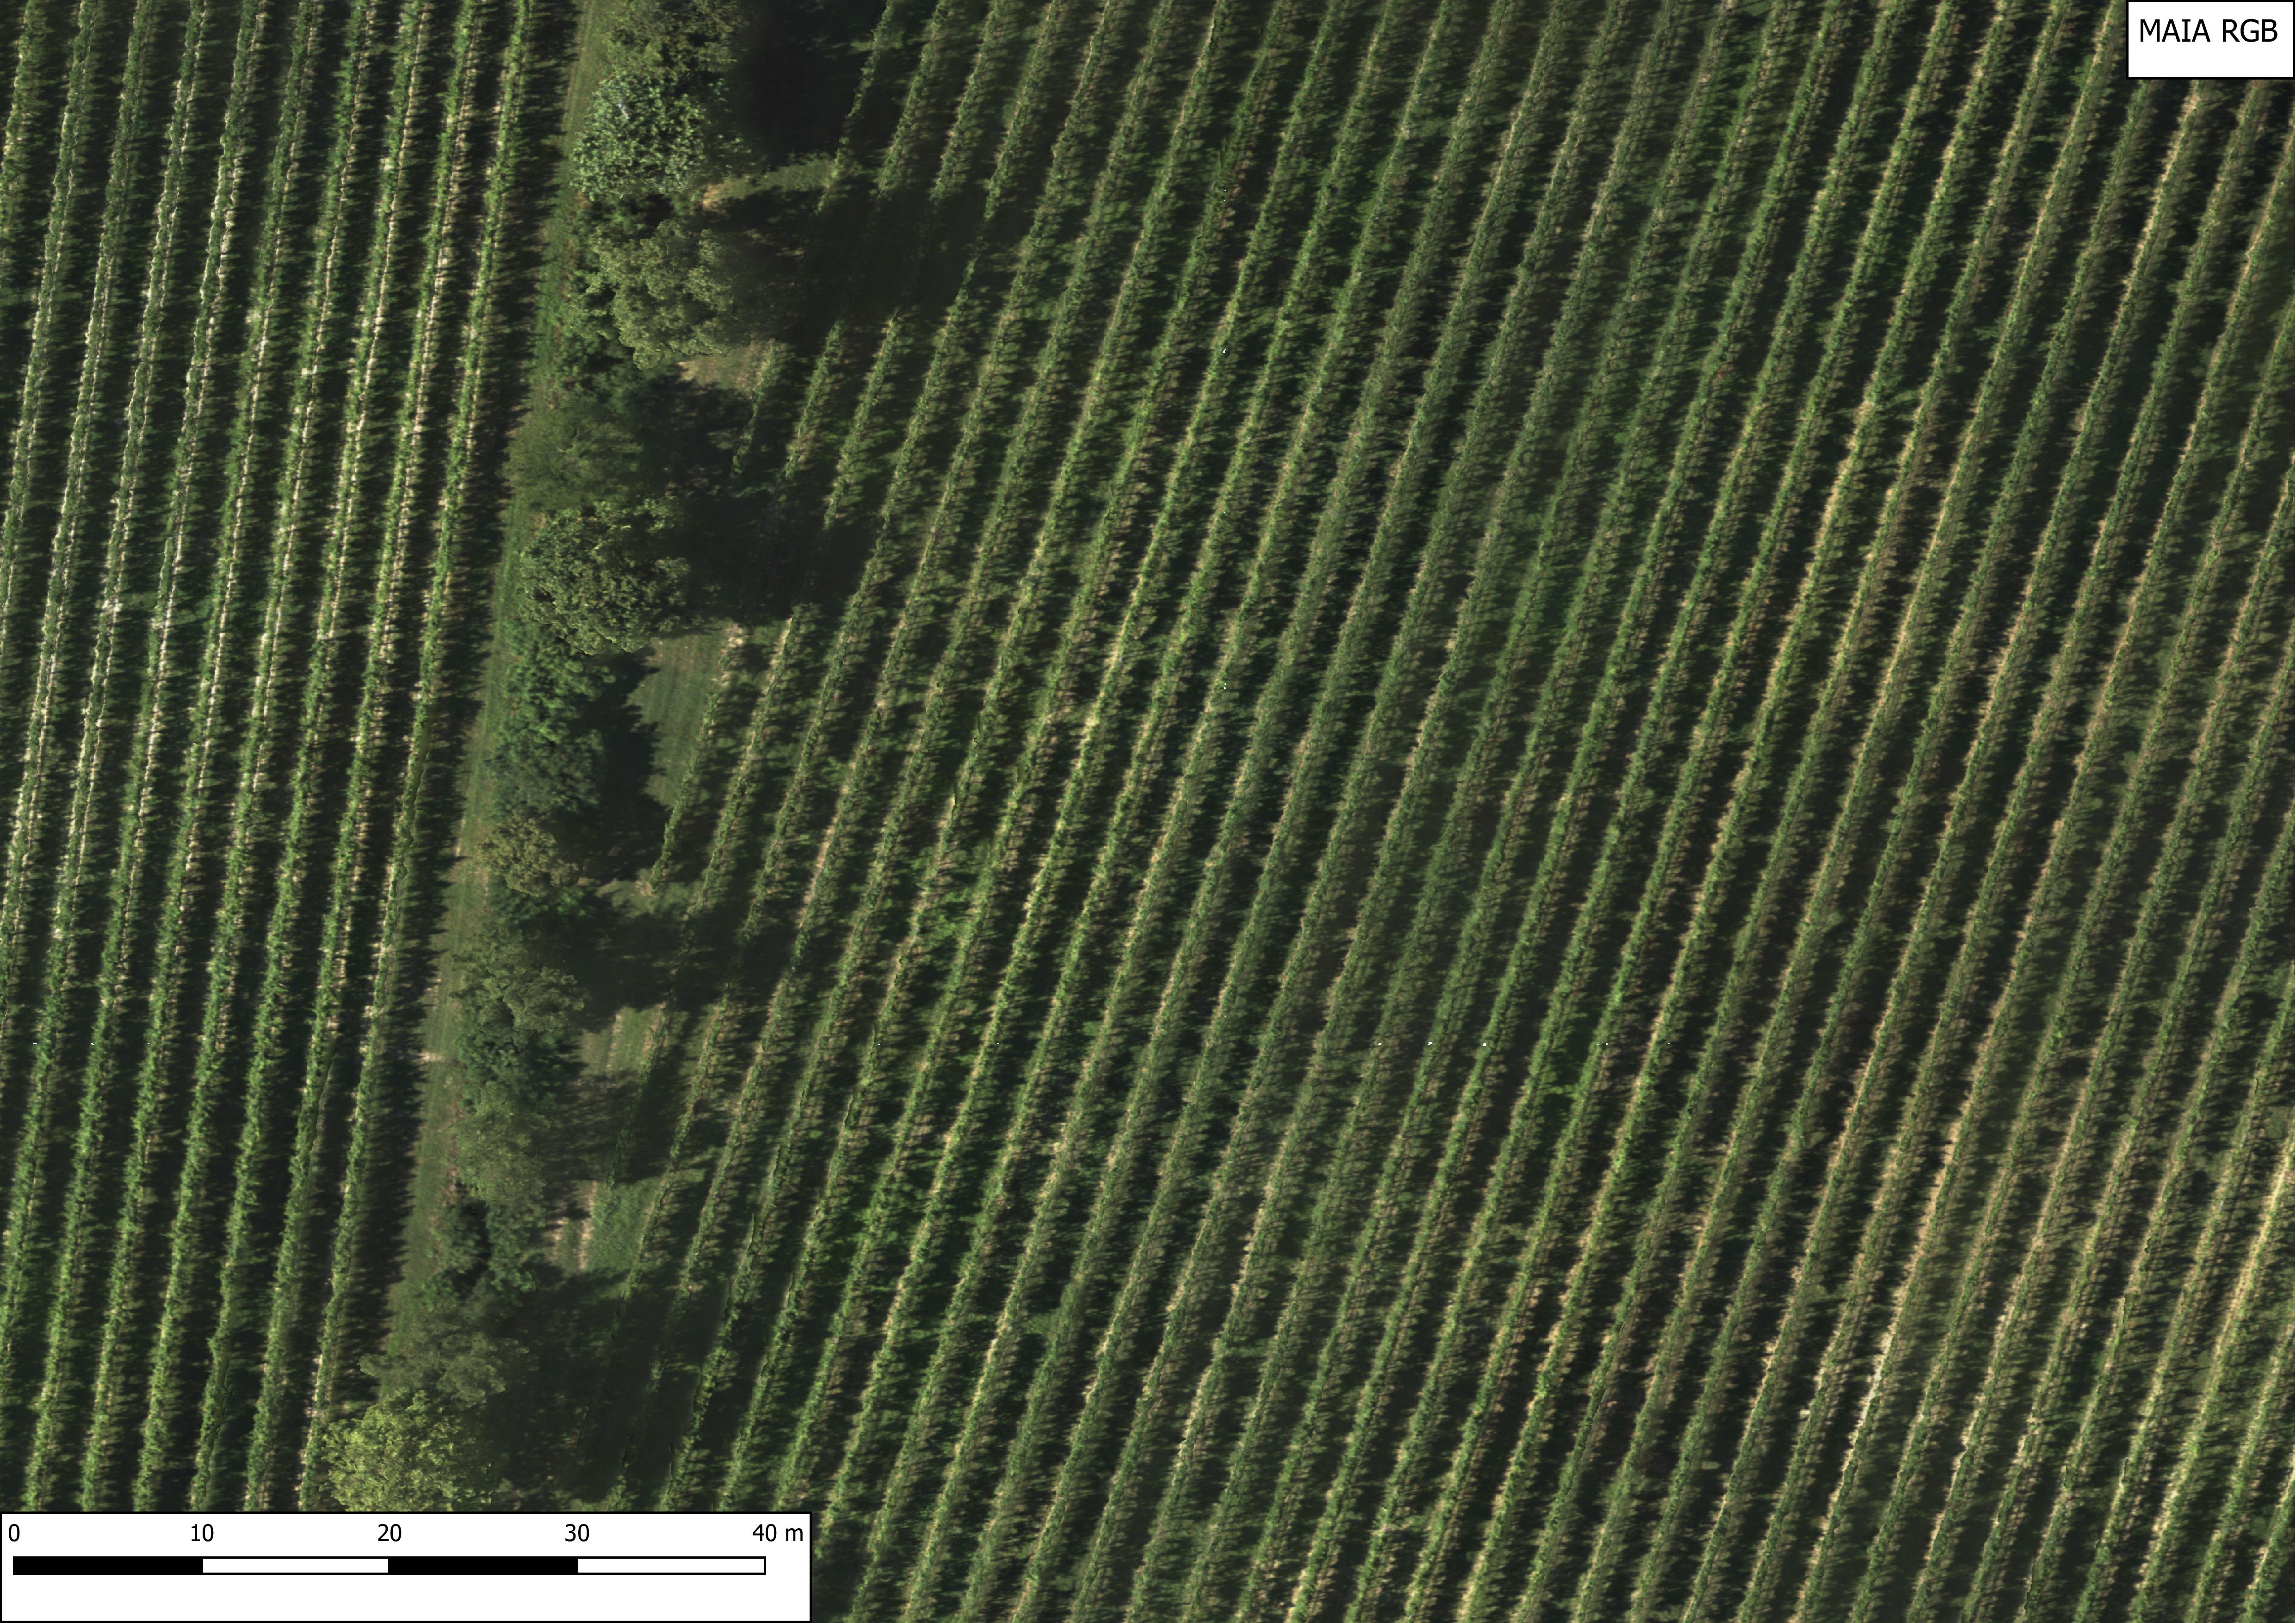
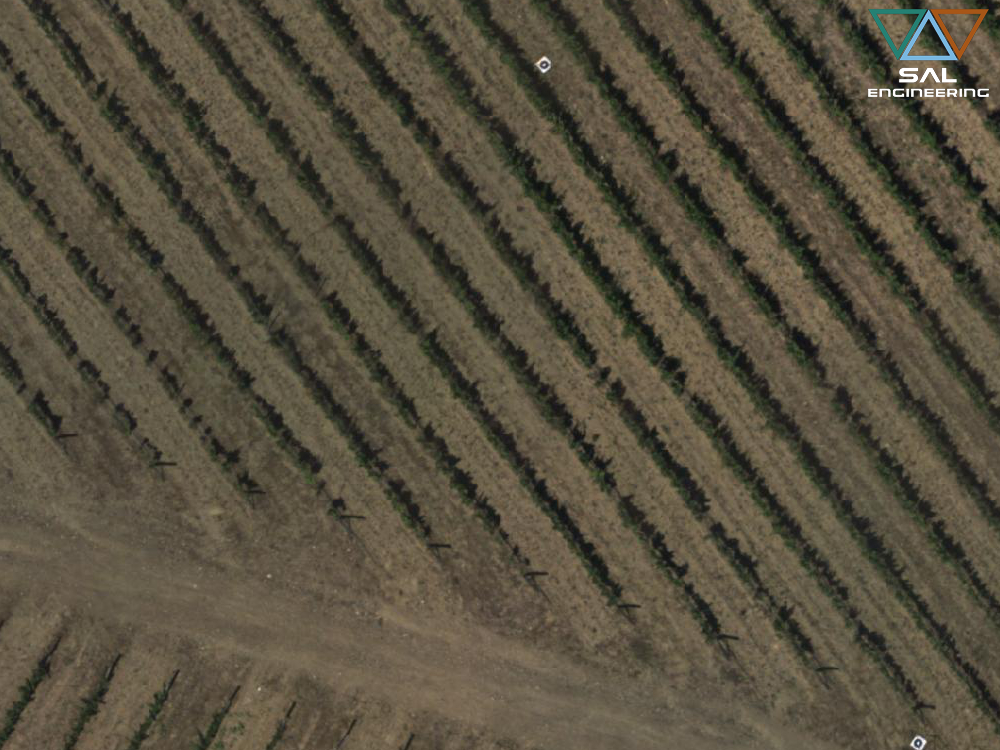
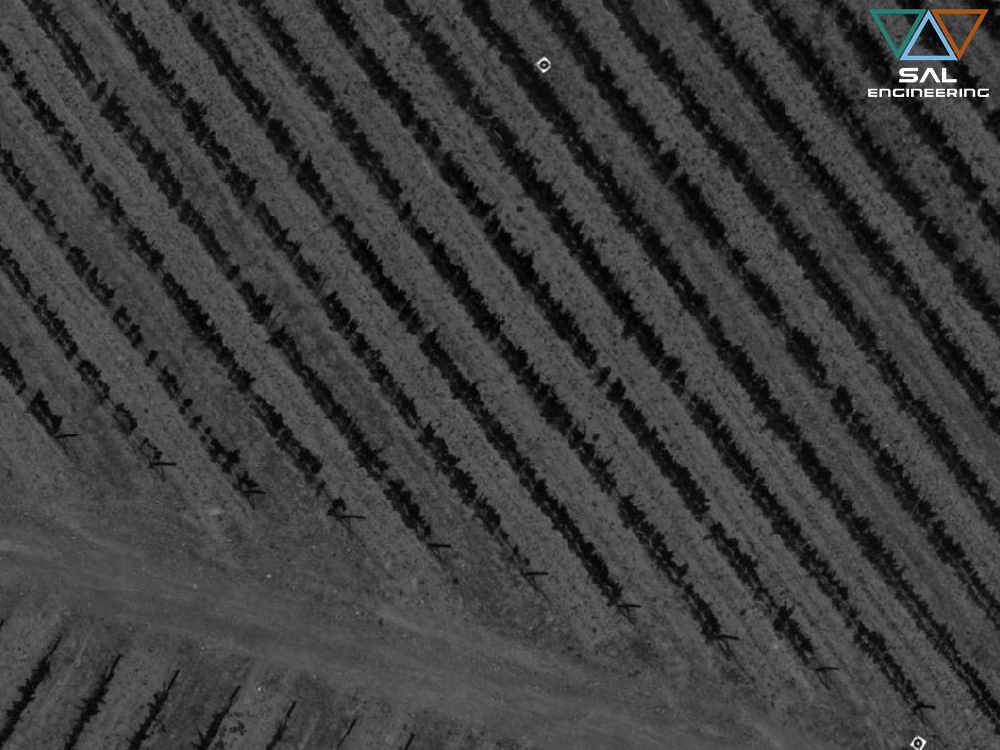
At last, here below you can view the same portion of a Franciacorta vineyard in a part of orthophoto mapped in RGB and in different indexes:
RGB 
SAVI w/ NIR 1 and L=0.5 
GNDVI w/ NIR 1 
NDVI w/ RED EDGE 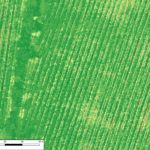
NDVI w/ NIR 1 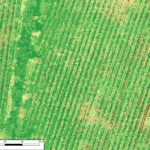
NDVI w/ NIR 2 From multispectral data, it is possible to obtain a series of indexes capable of describing precisely the characteristics of the vegetation present on the soil. Among these vegetation indices, the best known is the Normalized Difference Vegetation Index (NDVI), which is based on a normalized difference between the near and red infrared bands. As evidenced by countless studies, the NDVI proves very reliable in describing the magnitude of photosynthetic active biomass present on the investigated surface. The NDVI index is in fact correlated positively with the amount of plant biomass per unit of surface (LAI, leaf area index) and, therefore, the vigor of culture. The index assumes values between +1 and -1: in particular, from 0.1 to 0.3 we usually find a naked or slightly inert soil, while in the case of plant biomass there is an index higher than 0.5, and it increases to identify a different vegetative state of the plant, and an increasing production of chlorophyll.
The contribution of specific vegetative indices to viticulture has been extensively studied and demonstrated, but it should be remembered that other interesting thematic maps for viticulturists can cover crop yields, acidity, sugars, polyphenols, anthocyanins.
-