Mapping of anthropogenic stress in vegetation and soil


Mapping of anthropogenic stress in vegetation and soil

Techniques of acquisition, processing and interpretation of multispectral data related to key environmental processes such as chlorophylline photosynthesis and plant nutrition, have been refined, especially in relation to the identification and mapping of anthropogenic stress caused by soil infiltration or dispersion of polluting material on the surface. Recent research suggests that there is a distinction recognizable by data acquired through multispectral relief, between natural stress due to, for example, drought and an induced or anthropogenic stress due to soil contamination: this difference is visible in a different physiological response of plants (Zinnert and others, 2012).

A series of computations between multispectral bands, known as vegetation indices, have been developed and applied in agronomy and environmental sciences to optimize information from multispectral data, which has an increasing geometric, spectral, radiometric and temporal resolution since new acquisition technologies such as RPAS and new sensors have seen significant technological development over the last decades (Thenkabail, 2000).

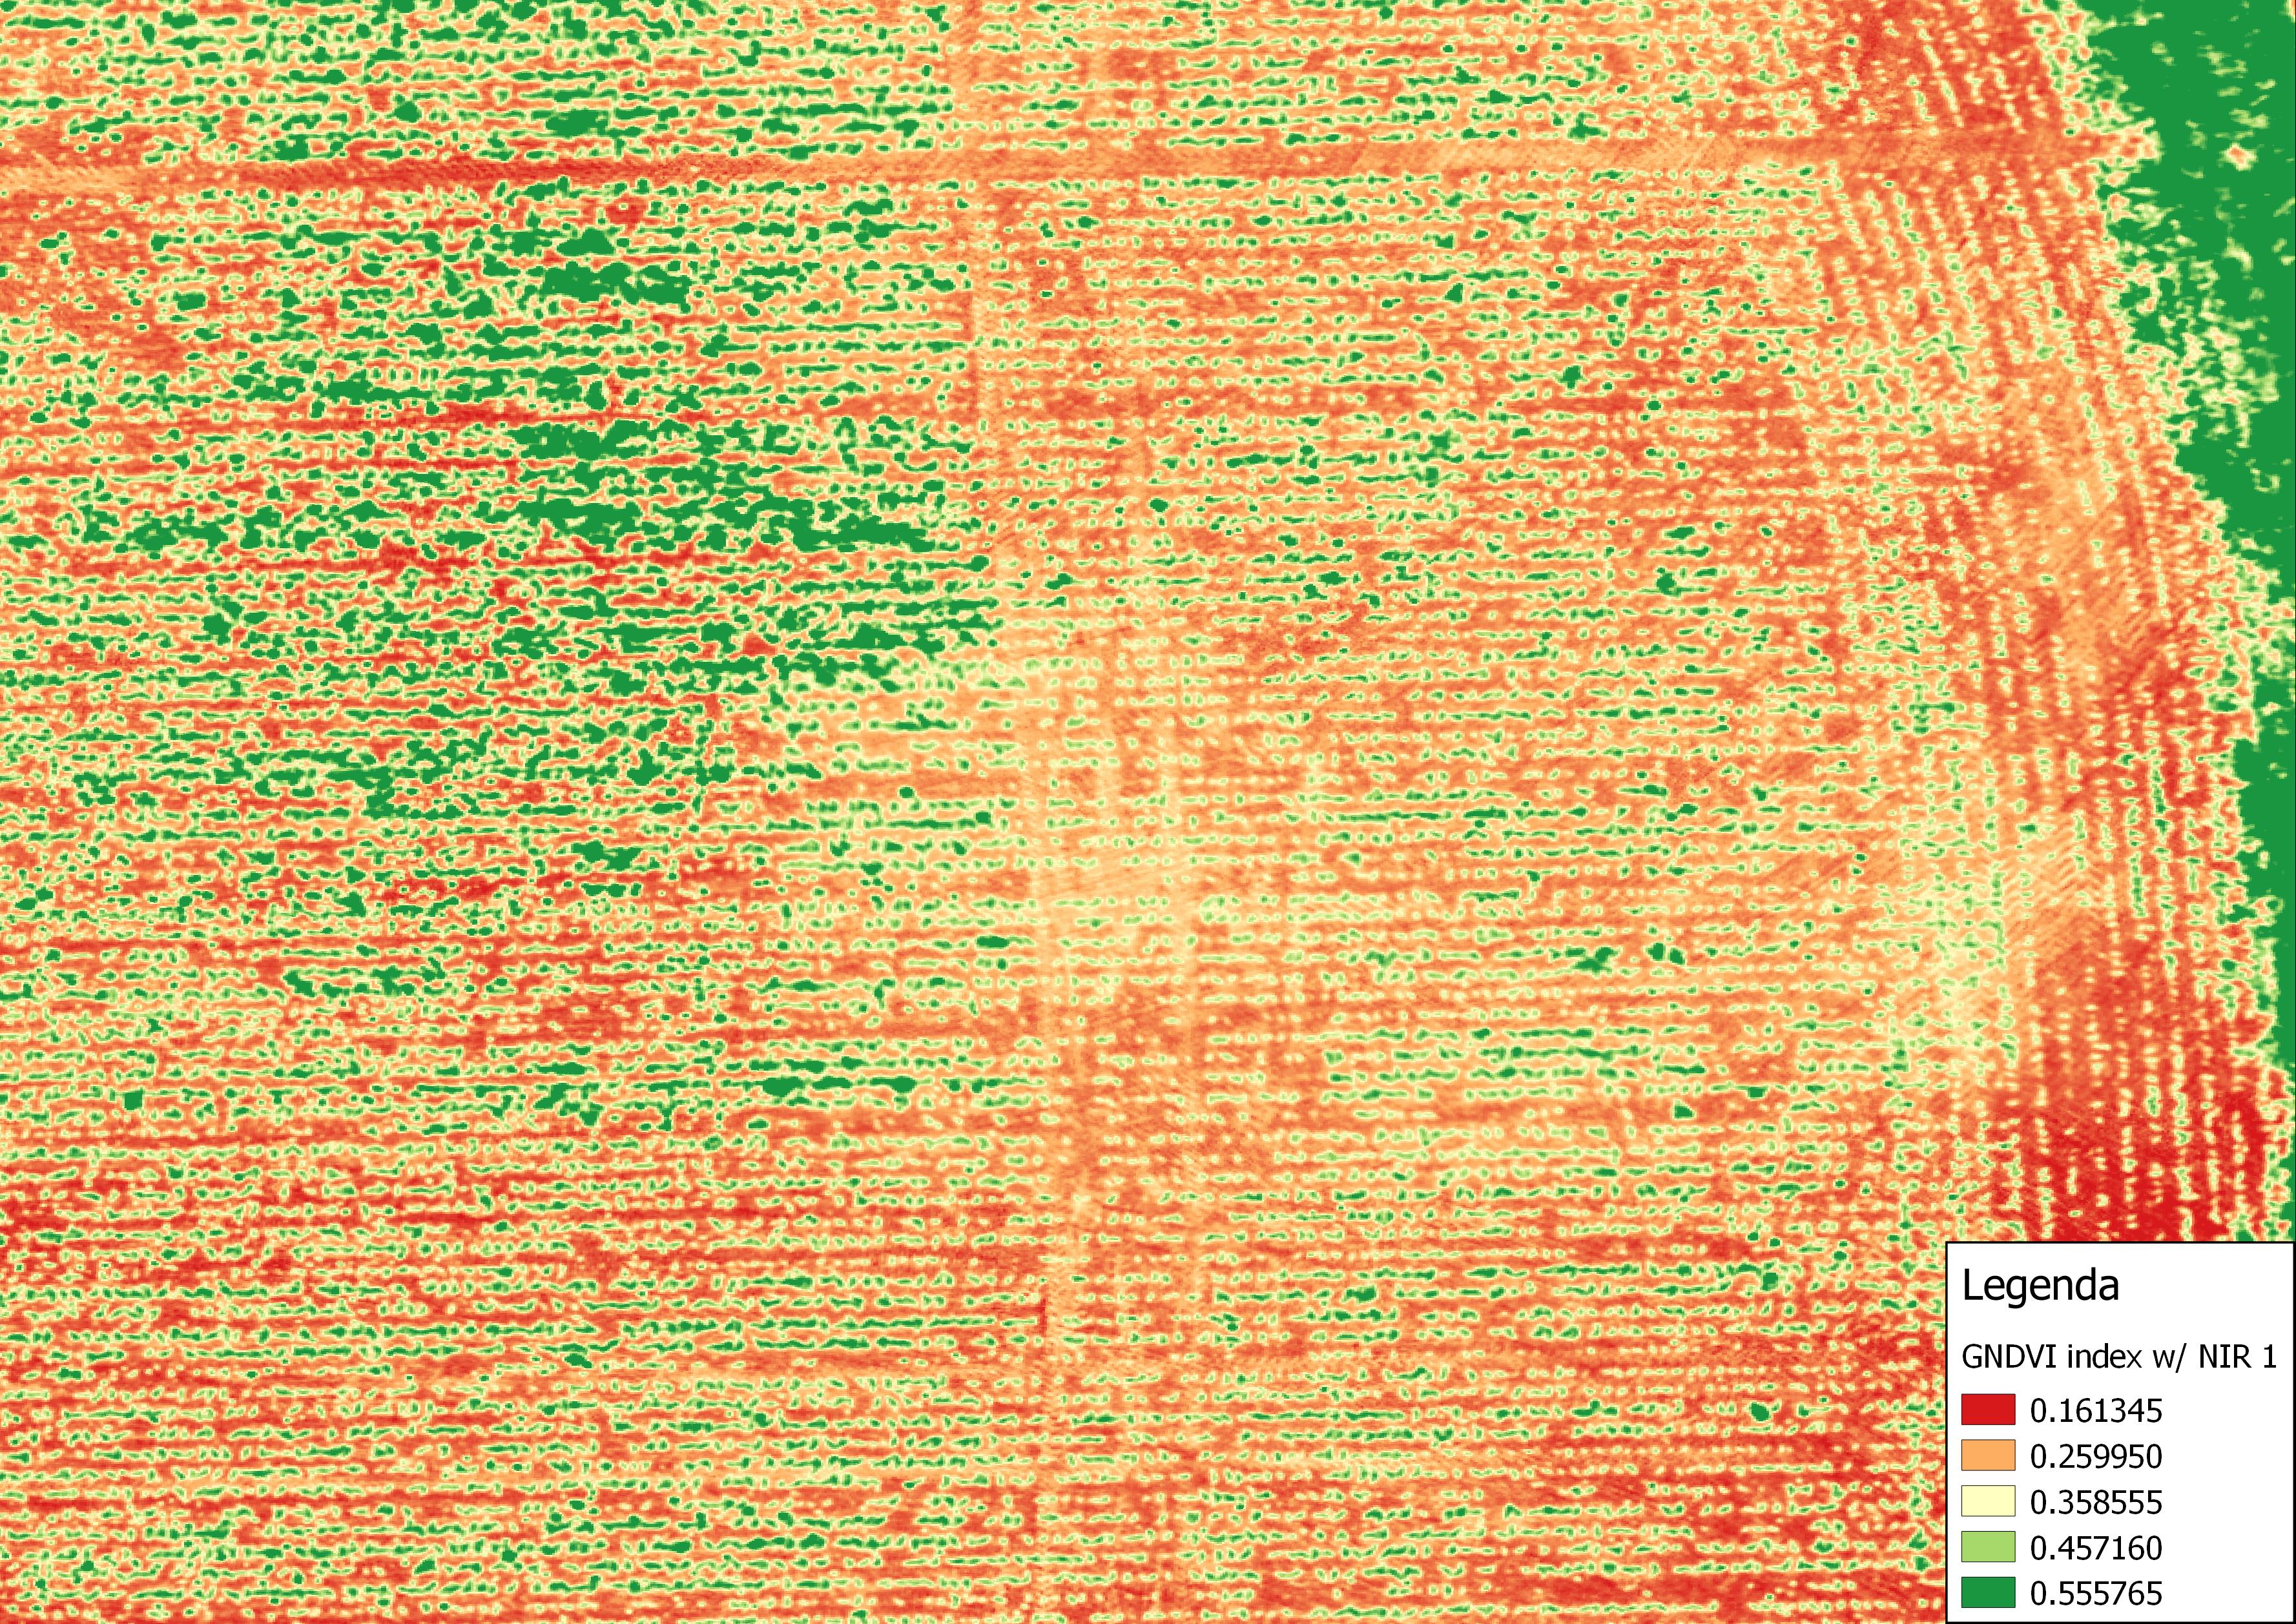
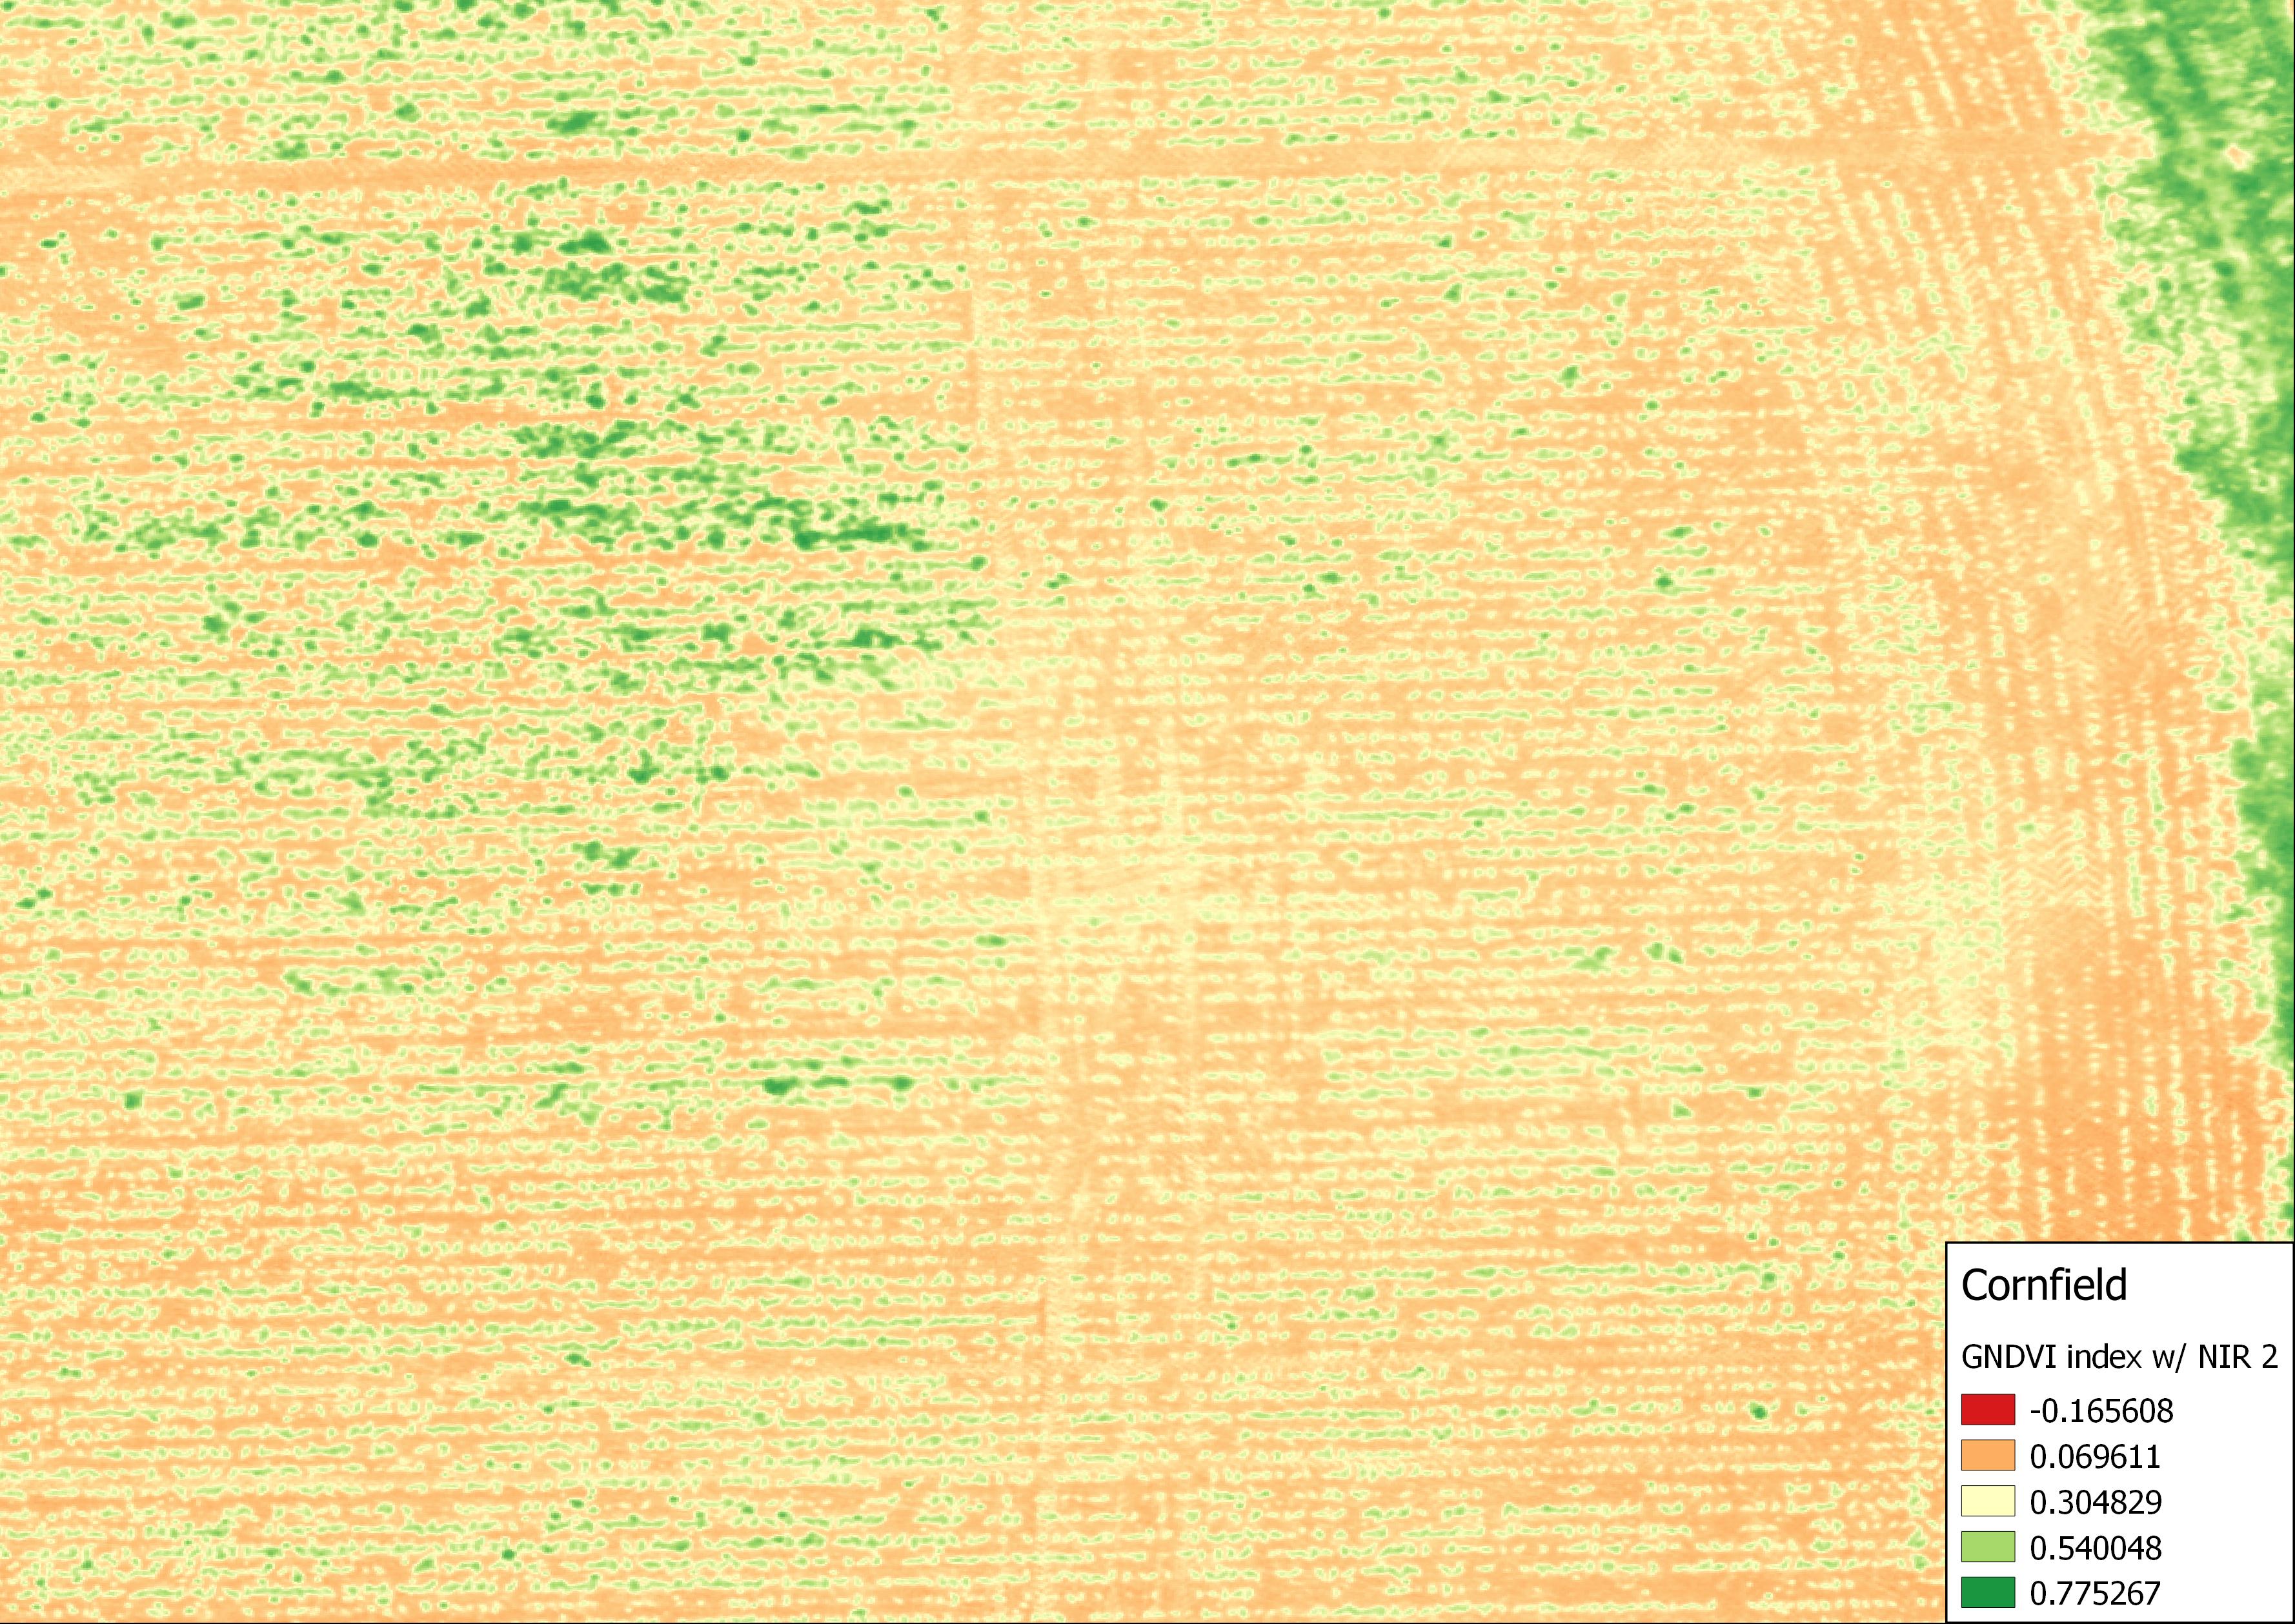
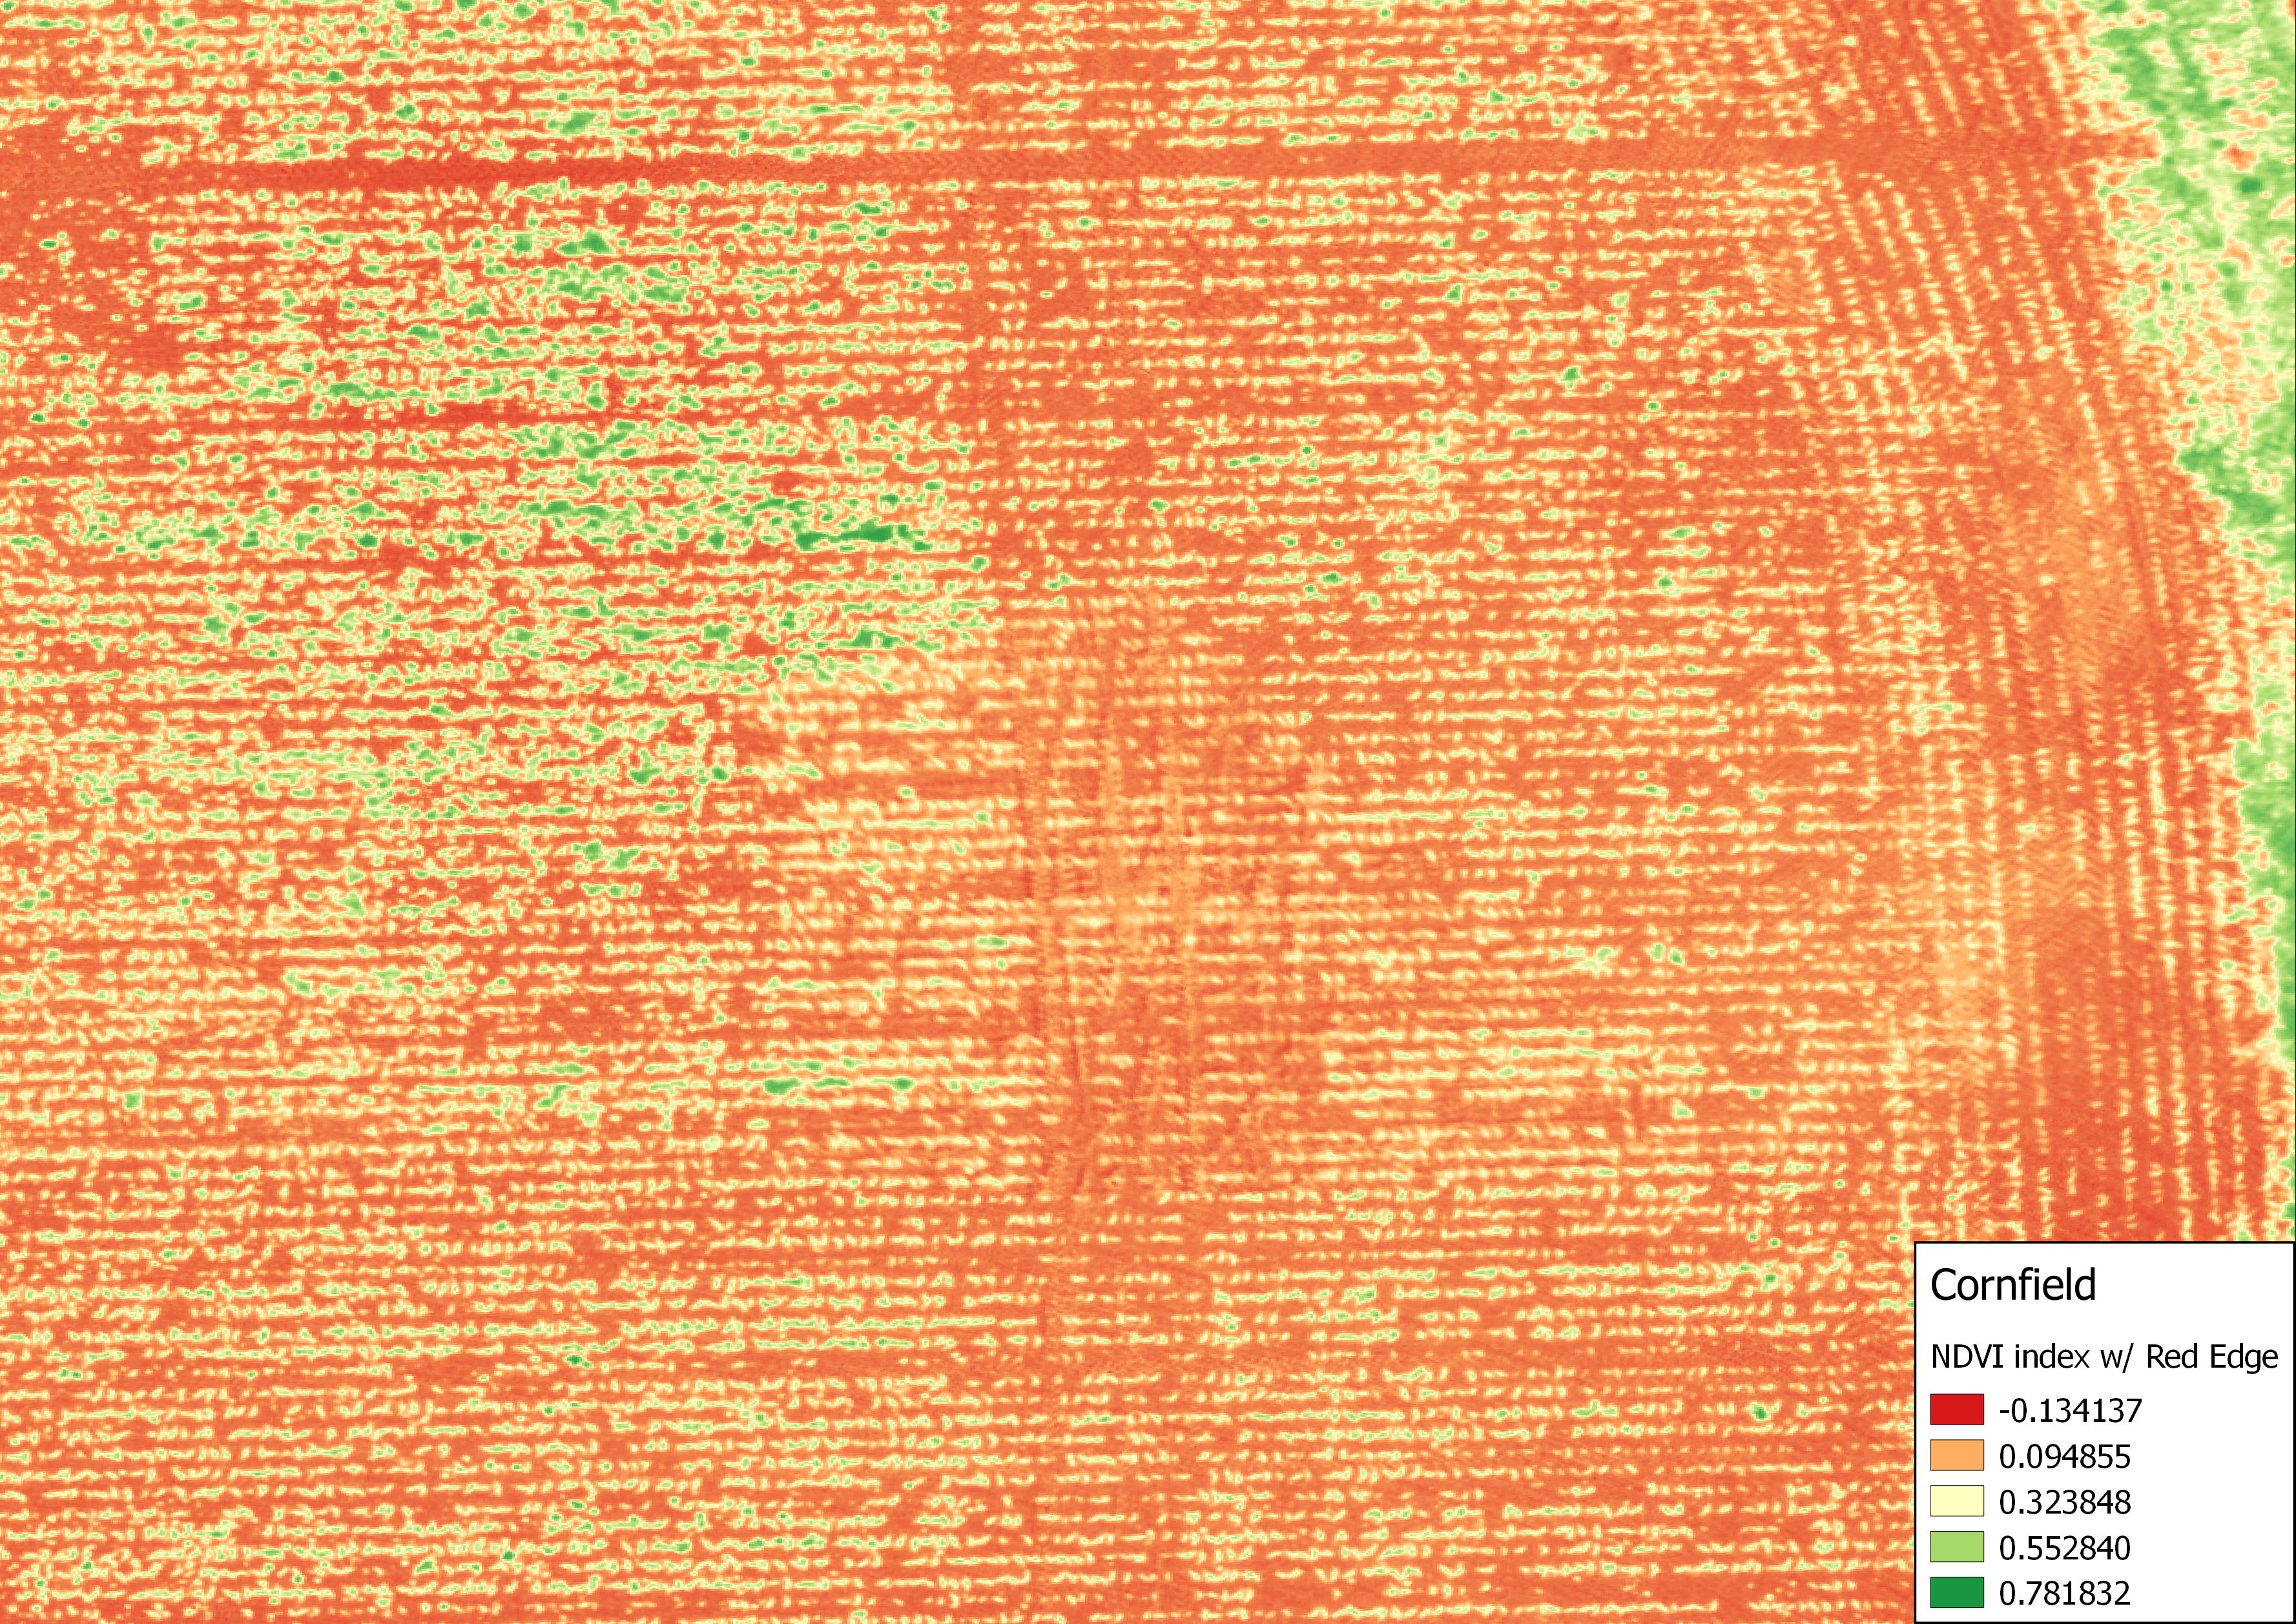
For environmental and agronomic applications, the bands most involved in the calculations are Red (630 nm to 690 nm), Red Edge (705 nm to 745 nm), NIR (750 nm to 950 nm), Green (525 nm to 575 nm) and Violet (390 nm to 450 nm). The main vegetation indices are the Normalized Differentiation Vegetation Index (NDVI) and its optimizations or transformations such as the Green Normalized Differentiation Vegetation Index (GNDVI), Soil Adjusted Vegetation Index (SAVI) and also in this case including its optimizations such as the TSAVI (Transformed Soil Adjusted Vegetation Index) or the Modified Soil Adjusted Vegetation Index (MSAVI). A very important index for evaluating water content and quality in vegetation and soil is NDWI (Normalized Difference Water Index). By applying the multispectral survey to environmental monitoring of soil matrix or vegetation matrix, these indices are useful for defining growth rates and the vegetative quality of leafy vegetation.

The study of one of these spectral bands, the Red Edge, allows specifically to classify vegetation contaminated by presence in the soil by inflow or gaseous hydrocarbon suspension.

To apply this method of analysis, it is necessary to first correctly classify the vegetation present on the soil and evaluate the moisture content, the species present, the vegetation cover, the leaf cover index, and the surface temperature in different lighting stages and in different seasons. Vegetation growing in soil contaminated by hydrocarbons has visible damages in the Red Edge band, which is the name given to the sudden change in the spectrum region ranging from 680 nm to 730 nm and is caused by a combined effect of a strong incident radiation absorption and strong inner reflection and scattering of the leaf called “leaf internal scattering”.

The shift in the Red Edge reflection of vegetation, which indicates a reduction in plant health or a stress condition linked to anthropogenic contamination, has long been studied and applied to the agronomic and environmental study of cultivated or vegetated areas.

Important tests in this field were carried out by our R&D team on a soil with heavy hydrocarbon contamination: applied remote sensing outputs that were compared in GIS environments were the multi-spectral orthophoto of the 8 bands of MAIA WV, one thermal orthophoto obtained with high resolution thermal camera and an RGB orthophoto always obtained with MAIA’s RGB sensor. With regard to site investigations in collaboration with environmental engineers to which these products serve as mapping basis for macro-assessment of contamination problems, it was possible to identify and map vegetal anomalies related to the presence of hydrocarbons in the soil, also found in a variation in surface temperature, as well as in a different reflection in the NIR band and, as previously mentioned, particularly in the Red Edge band, and in some indexes.


Figure 1: Detail of the Red Edge band image of a terrain with hydrocarbon contamination.
Figure 2: Detail of a thermal orthophoto of a terrain that is contaminated by hydrocarbons.
Figure 3: Detail of a RGB Orthophoto of a terrain that is contaminated by hydrocarbons.

The field activity is supported by valid scientific publications (Noomen, 2003 & 2008), in which the high-quality method is certified and in which there is evidence of high susceptibility of crops in the presence of gaseous hydrocarbons deposited on the ground or surface stagnation, and more specifically in the presence of Ethane gas (C2H6): cultures exposed to this gas are more spectrally reflected in bandwidths ranging from 570 nm to 700 nm (Noomen 2008).

Thanks to the multispectral survey made with MAIA WV, it is also possible to detect an accentuated concentration of metals in the soil matrix. Wu et al. (2007) demonstrated that spectroscopy in visible and near infrared regions has a strong negative correlation with certain metals (Cadmium, Chrome, Copper, Mercury, Lead, Zinc) in contaminated soils, depending on the presence iron oxide and carbon content. Chloe et al. (2008) and Wu et al. (2008) continued fruitful research on the use of multispectral remote sensing to diagnose the presence of high concentrations of certain metals in contaminated soils.

Other scientific studies (Asmaryan et al 2014) confirm the positive correlations between the presence of chromium, lead and zinc measured in the site and detected by multispectral survey, on non-vegetated soil (whose NDVI index by definition goes from 0 to 0.3). The same studies have identified specific reflectance values at certain wavelengths of certain metals in the soil matrix, as shown in the table.
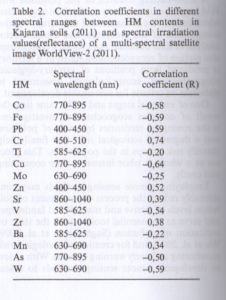


Figure 4: Correlation in different spectral ranges between metal content in non-plant soil and spectral values derived from a WorldView-2 satellite image.

Concerning the multispectral knowledge of the ground matrix, MAIA WV images, related to the wavelength ranges of satellites investigating the spectrum from visible to infrared such as Landsat TM, World-View 2 and Sentinel-2, can be processed to locate and map a large set of minerals, including iron oxides, clays, and other hydroxyl minerals that are often in nature at hydrothermal alterations in the outcrops (Source: Andrea G. Fabbri, Gabor Gaál, Richard B. McCammon, Deployment and Geoenvironmental Models for Resource Exploitation and Environmental Security, Springer Science & Business Media, 2012).


“Which future for the employment of drones in agriculture?” on L’Informatore Agrario

“Which future for the employment of drones in Agriculture?” on L’Informatore agrario journal

We proudly share this article written by Francesco Marinello, Luigi Sartori (Dipartimento Tesaf – Università di Padova and Neos srl) and Simone Gatto (Dipartimento Tesaf – Università di Padova) and published on the magazine L’Informatore Agrario n°39 (© 2017 Copyright Edizioni L’Informatore Agrario S.r.l.) concerning the benefits of multispectral survey and of other survey tecnologies for Precision Agriculture. Here is a statement in which they talk about MAIA – The Multispectral Camera.

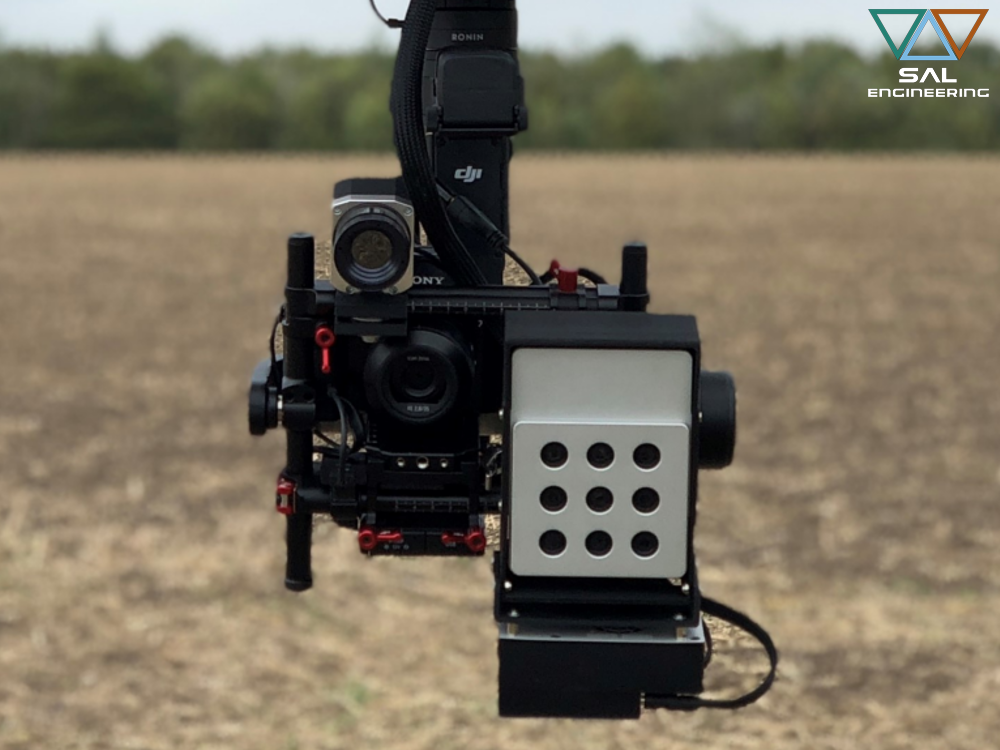
“Multispectral cameras are more and more useful instruments in Precision Agriculture. Their flexibility in use increases with the number of bands available. For example, MAIA (one of the most interesting instruments on the market, realized by SAL Engineering) with 9 monochromatic sensors in 9 different bands permits to calculate over 20 vegetational indices among the most common. Those indices are efficient in Precision Agriculture to define agronomical interventions in different vegetative moments of the colture, thanks to the support given by the prescription maps, in the planning of time and distribution of the harvest, in recognizing health deseases or points of maturation, and in general to evaluate the vegetative health status of the colture”.

You can read and download the full article by clicking the link below.

2017 39 Informatore Agrario

Credits:

L’Informatore Agrario © 2017 Copyright Edizioni L’Informatore Agrario S.r.l.

Francesco Marinello, Luigi Sartori
Dipartimento Tesaf – Università di Padova e Neos srl
Simone Gatto
Dipartimento Tesaf – Università di Padova

Benefits of precision agriculture: from EXPO 2015 to CAP 2014-2020

Benefits of precision agriculture: focus on Italy

Precision Agriculture, also known as Precision Farming, is a strategy in managing agriculture due to the potential of the widespread application of innovative solutions. According to its original meaning definitions, it consists in “applying technologies, principles and strategies for spatial and temporal management of variability associated with aspects of agricultural production” (Pierce and Nowak, 1999), in relation to the real needs of the parcel and their spatial and temporal variability. Precision farming on large scale was born in the United States in the 90s to be used for large crops of cotton and maize, and more recently it is increasingly spreading in small plots, just because it guarantees rationalization of cultivation and greater efficiency.

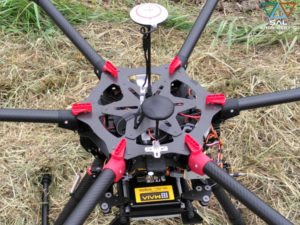
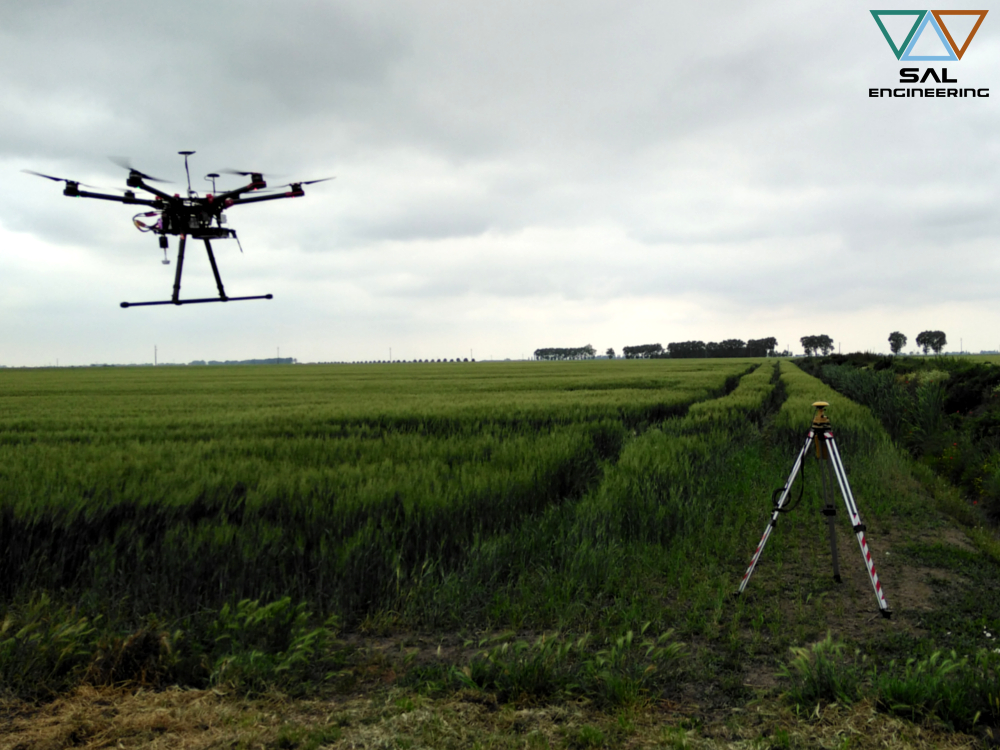
DJI S900 equipped with MAIA

The main variable to consider is not the extension but rather the problem of being able to avoid ever more uniformity of treatment for crops placed on different soils affected by different problems, which can generate non-rational use of fertilizers, pesticides, herbicides. Precision farming is an innovative form of agriculture, driven by the use of techniques and technologies aimed at the implementation of agronomic interventions with varying intensity within the different crops of land, on the basis of the actual need for cultivation and of the chemical, physical and biological properties of the soil. The Guidelines for the Development of Precision farming in Italy represent a vademecum of technical, regulatory and scientific sources and proposals which in addition to defining the principles, methods and technologies, identifies the actions and tools suitable for achieving in 2021 the goal of managing 10% of the cultivated agricultural national area. All information has been ordered to promote business management (agriculture, forestry and zootechnics) with new tools and technologies that make it “the right thing, the right place at the right time”, with the most ambitious goal of introducing simplified site-specific analysis models as a decision support system for the entire business management, optimizing returns in the light of advanced climate environmental and economic sustainability.

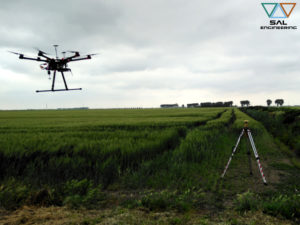
GPS Master and DJI S900 equipped with MAIA

The Italian Government plan, launched in 2015 with the fruitful scientific and economic consultations of EXPO 2015, identifies a company model to which this project is primarily aimed: companies with an average size of 7 hectares. Governments and regions can use EU rural development funds to reach an ambitious goal: get within 5 years to have 10% of the areas cultivated by Precision farming.

Precision farming principles now can be applied to all agronomic operations (soil cultivation, sowing, fertilization, irrigation, crop protection): it’s important to keep in mind that the assumption to apply market solutions is the strategic management of intra-field and inter-field geographic variability, and thus the management of the information obtained from the surveys carried out with new generation sensors. Such a management allow to achieve different advantages:

  • in the agronomic field, by increasing the crop performance

  • in the economical field, through the best use of inputs and the reduction of crop costs

  • in the environmental field, because reduces the use of pesticides, herbicides, fertilizers.

The aim of precision farming is also to manage the variability that exists within the crop by the means of resources and technological solutions to optimize the use of productive factors reduce costs and preserve natural resources. The first step is to know the variability within the field: crop mapping by photogrammetric surveys with multispectral, hyperspectral and thermographic sensors is the most widely used technique for collecting data on variability in crop health conditions and on yield variability, integrated with timely observations conducted by meteorological stations.

The agronomic application of this knowledge, that basically consists in the transformation into agricultural interventions, is through the use of variable-rate agricultural machines equipped with GPS, ISOBUS technology and spraying management software, whereby the grower will act in a manner rational culture, it will always be able to monitor its interventions in the future and improve production in terms of quantity and quality. The application of these techniques involves different intervention and processing costs depending on:

  • type of crop (arable land, orchard, vineyard, fruit and vegetables, etc.)
  • crop extent
  • climate reference conditions
  • technological development framework for the agricultural production process
  • technological development framework for the decisional production process
  • phytosanitary framework that is to be maintained for cultivation

The application of Precision farming technologies makes European agriculture more sustainable and profitable: to say that is a new report by the European Commission’s Joint Research Center (Jrc), named Precision agriculture: an opportunity for EU Farmers – potential support with the CAP 2014-2020. Indeed, recent studies on yield monitoring show that the application of localization technologies and targeted interventions leads to a net savings of 15% to 50% depending on the variables that define, as above, the nature of the farm and its production process. Farming management of this type allows to increase the efficiency of the production system by streamlining the individual interventions. In Italy, the application of Precision farming is very heterogeneous and affects only 1% of the whole agricultural area. At present the most advanced production chain is winery; they follow rice, cereals and zootechnics. The predictions for precision farming in Italy confirm the orientation towards development and its spread will increase rapidly over time, similar to what is happening in other European Union countries.