Wheat Lodging Assessment Using Multispectral UAV Data
In 2018 we conducted a multispectral campaign using MAIA S2 on wheat fields that had lodging problems. We planned the photogrammetric paths, agreed with agronomists and technicians the geometric resolution and the products that we had to derive from the photogrammetric and multispectral survey, then we set the parameters of MAIA to obtain the correct radiometric information in each band, in such a way as to provide all the data useful for both radiometric and geometric analysis, thus developing a field of study that will have great applications in the future: 3D multispectral data analysis. In our processing lab, we then processed the data and obtained multispectral DSM, multispectral orthophotos and a large dataset of radiometric and geometric sample measurements. Thanks to the study of a team of Italian and Dutch experts, that data acquisition service resulted in a scientific publication.
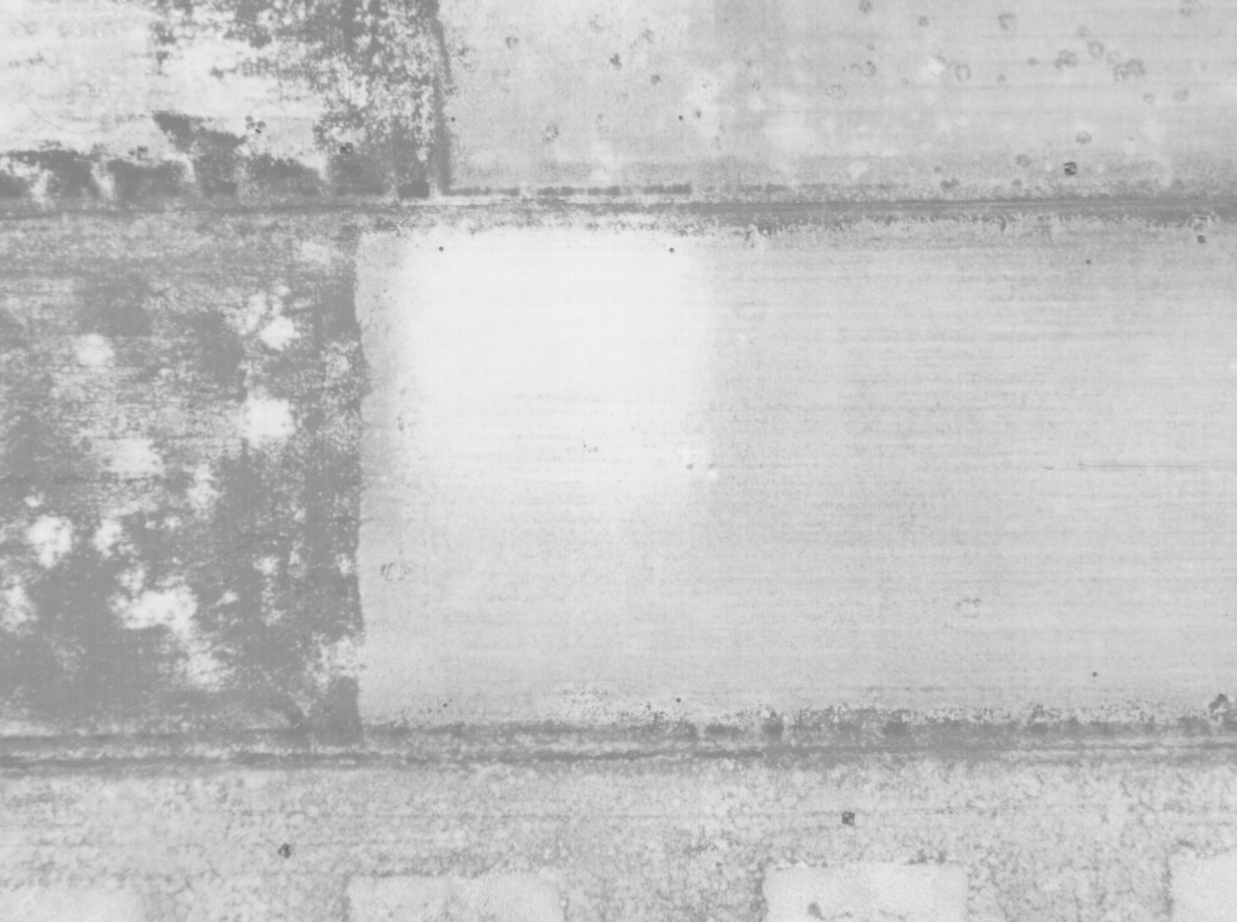
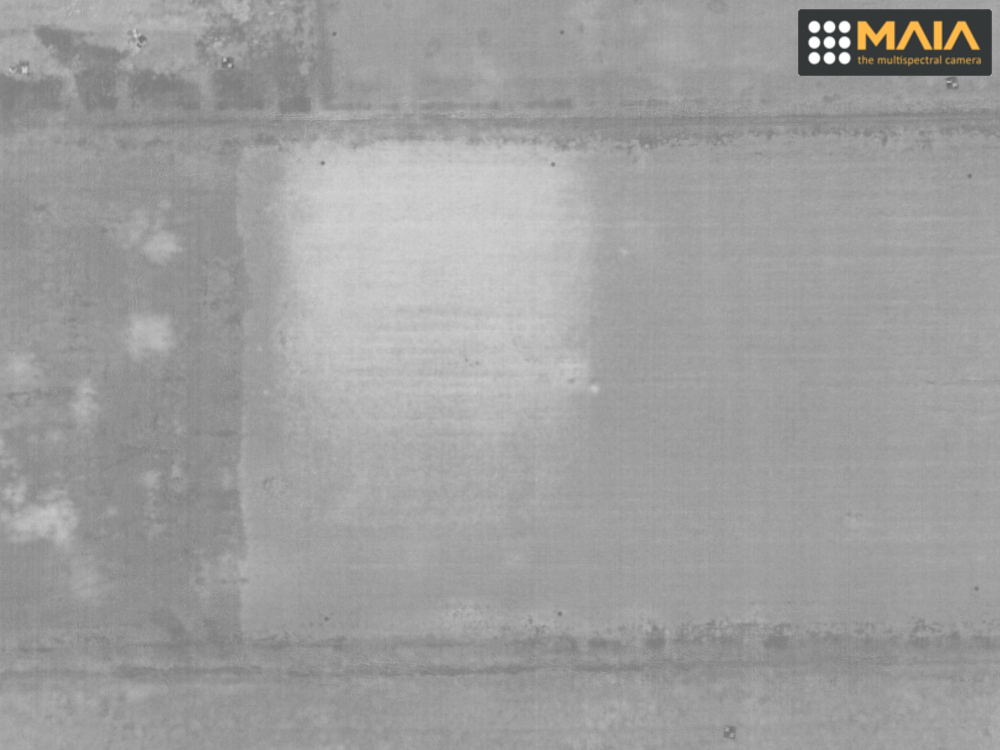
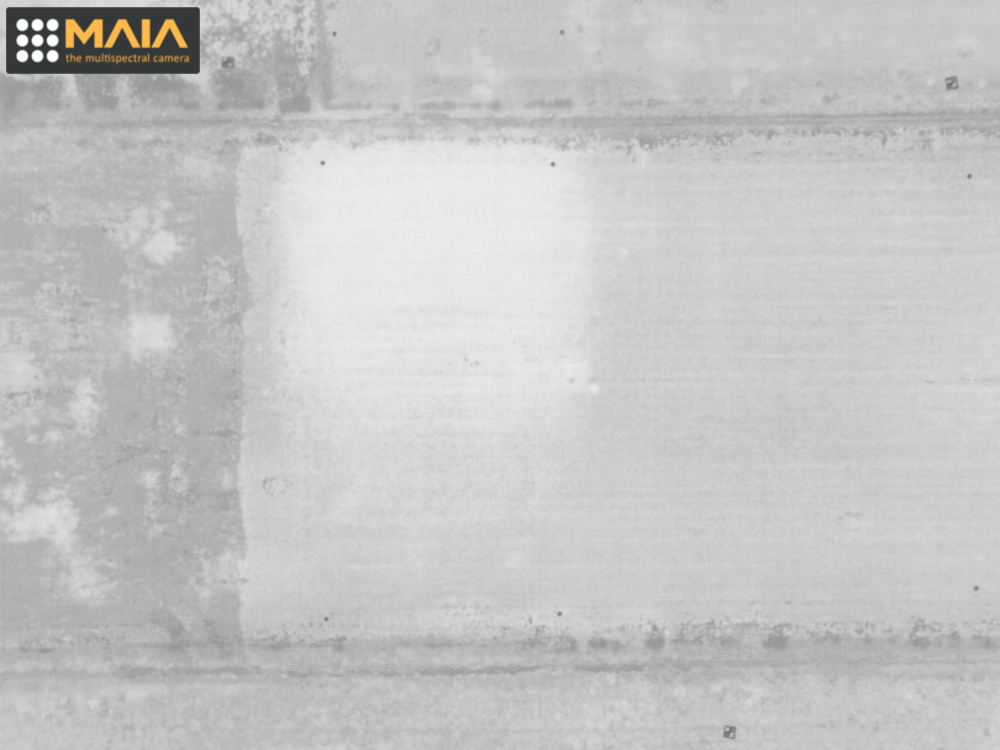
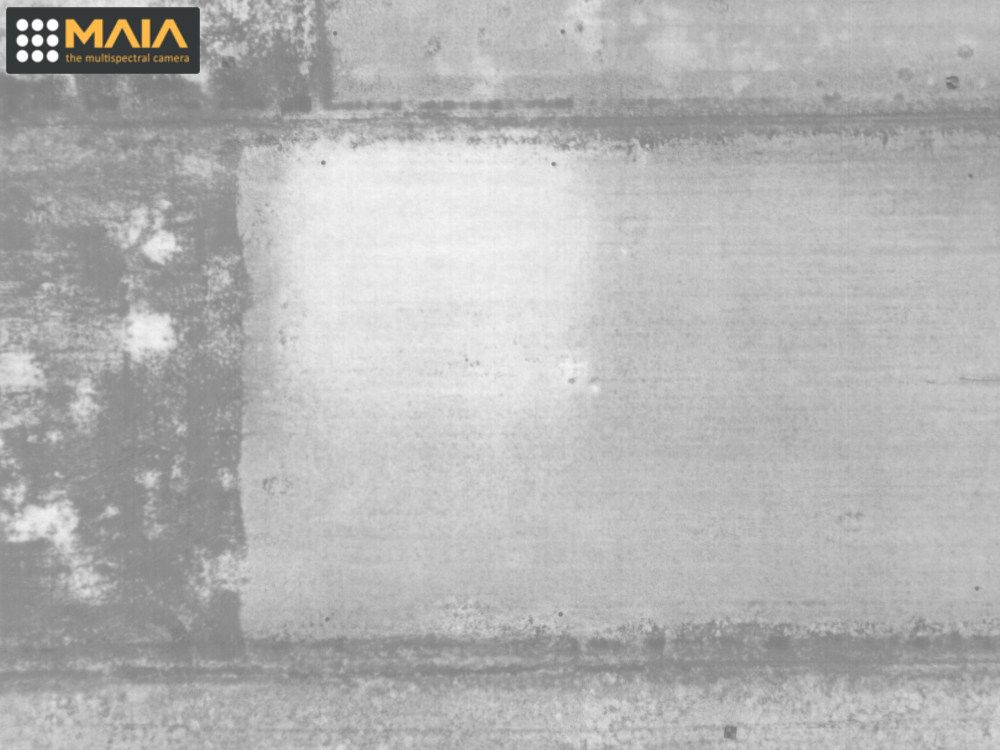
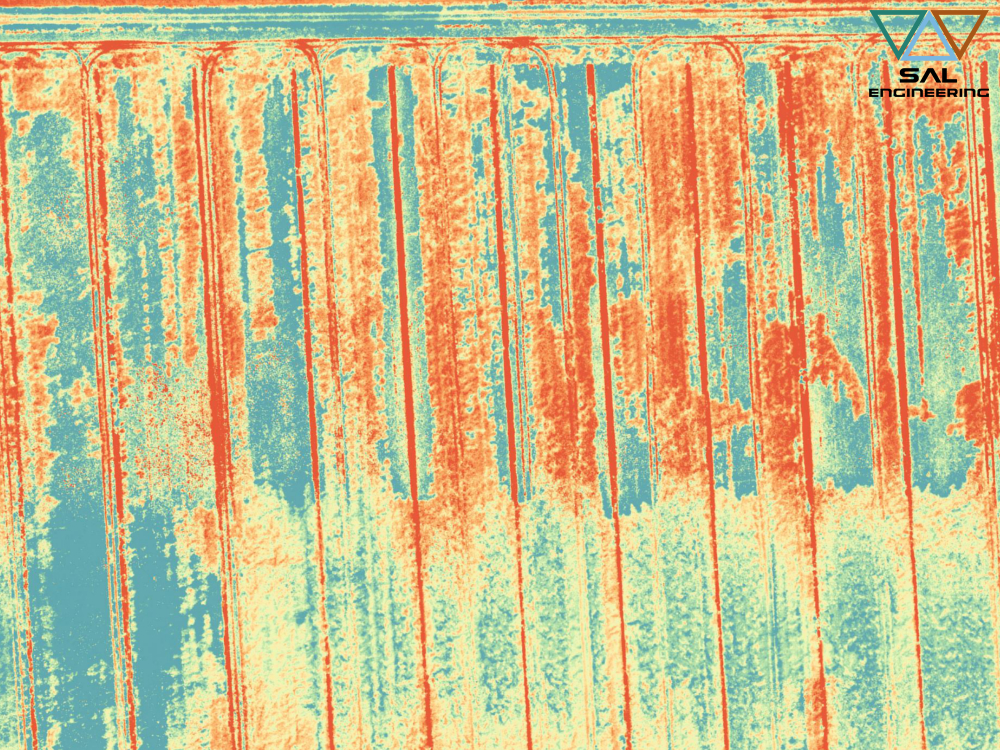
For the first time, high-resolution multispectral data from a UAV with nine spectral bands (the same as Sentinel-2) covering the 390-950 nm wavelength region has been utilized for lodging assessment. This enabled a comparison of spectral variability across nine bands. Overall, we found that there was an increase in the magnitude of reflectance spectra as the lodging became more severe. The increase was more pronounced in the green, red-edge and NIR regions of the spectrum, thereby showing the sensitivity of these bands to changes in the crop canopy structure. Furthermore, the overall classification accuracy was very high (90%) where NL, ML, and SL classes were separated with reasonable accuracy while there was some mixing of VSL class with the other groups. To conclude, bands in the range of 700- 950nm can effectively detect lodging in wheat. These results underline how multispectral data can be an advancement with respect to conventional RGB camera traditionally mounted on the UAV platforms. Although we believe that these results are transferable to different crop varieties and growing conditions, further research is required to assess this.
Click here below to read and download the article:
S. Chauhan 1, R. Darvishzadeh 1, Y.Lu 1, D. Stroppiana 2, M. Boschetti 2, M. Pepe 2, A. Nelson 1
1 Faculty of Geo-information Science and Earth Observation (ITC), University of Twente, Enschede 7500AE, The Netherlands – (s.chauhan, a.nelson, r.darvish)@utwente.nl, y.lu-3@student.utwente.nl
2 CNR-IREA, Institute for Electromagnetic Sensing of the Environment, National Research Council, 20133 Milano, Italy – (stroppiana.d, boschetti.m, pepe.m)@irea.cnr.it
The International Archives of the Photogrammetry, Remote Sensing and Spatial Information Sciences, Volume XLII-2/W13, 2019 ISPRS Geospatial Week 2019, 10–14 June 2019, Enschede, The Netherlands
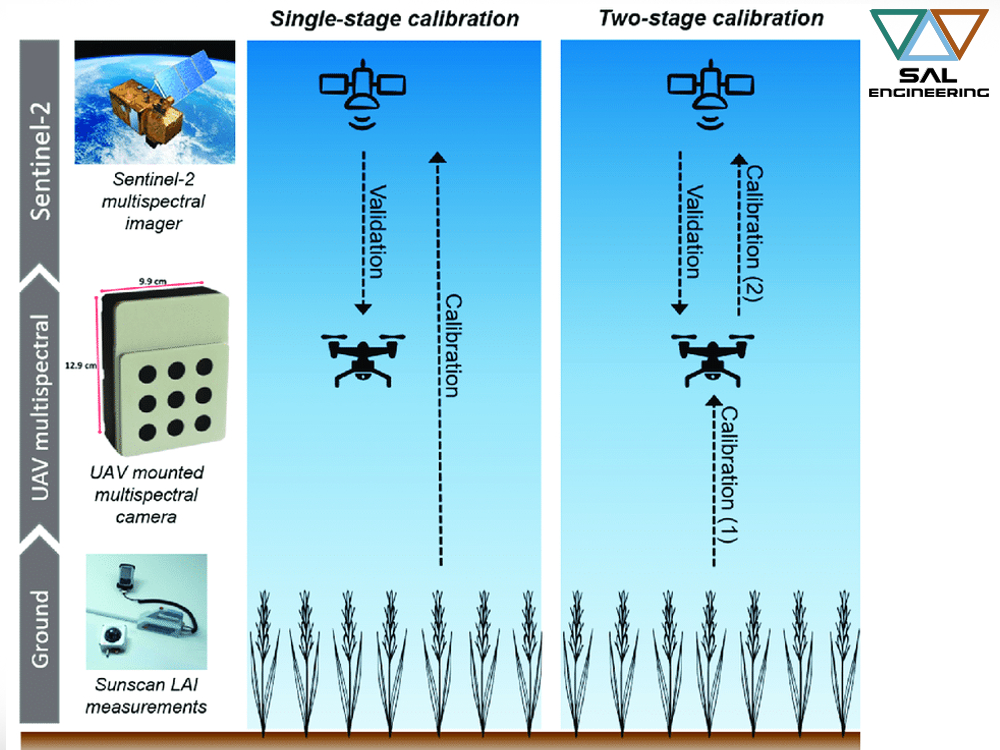
Quantifying Uncertainty and Bridging the Scaling Gap in the Retrieval of Leaf Area Index by Coupling Sentinel-2 and UAV Observations
Even within managed crop systems, there is considerable and important within-field variation in LAI at scales finer than the resolution of current satellite imagers.
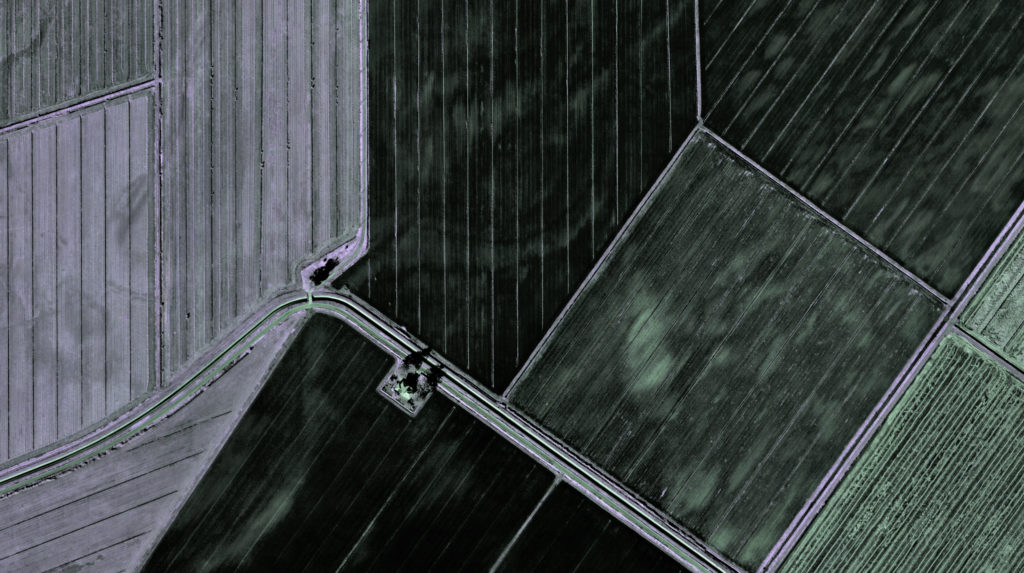
In this scientific research it is demonstrated that UAV multispectral observations at the cm scale, acquired from a sensor designed to match Sentinel-2 spectral bands, improve interpretation of the satellite signal.
Furthermore, the fine-scale resolution of the UAV sensor provides a tool for accurately upscaling LAI ground measurements, which were collected in coordination with the UAV flights, to satellite resolution. The within-field variance in spectral data resolved from the UAV observations was linked to wheat growth stage. Consequently, the Sentinel-2 and UAV platform data were more comparable at the later growth stages, when the vegetation canopy appeared more homogeneous due to a reduced influence of bare soil.
Calibrating models used to retrieve LAI from Sentinel-2 observations directly from ground measurements performed poorly and were unable to explain the variance in LAI throughout the growing season. On the other hand, our novel two-stage model calibration, involving the use of upscaled UAV LAI estimates, demonstrated a clear improvement in the accuracy of LAI retrievals from Sentinel-2 data, reducing bias strongly.
This study has highlighted the value of UAV observations for effectively providing a link between point measurements on the ground and 20-m resolution multispectral observations made from the Sentinel-2 satellite.
Bathymetry of shallow water using multispectral images taken from UAV
This article describes the research activity conducted by Dr. Leonardo Bassani in the Geography section of DISCI Department of the University of Bologna, in collaboration with SAL Engineering.
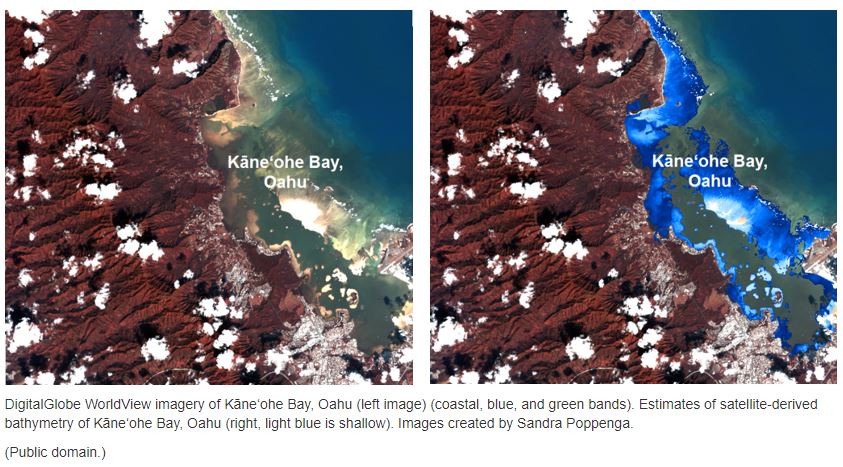
The traditional techniques in bathymetric surveys like multibeam, singlebeam or LIDAR are really expensive and require complex data processing. In the ‘80 and the ‘90, when the first multispectral satellite mission started to collect multispectral images of earth and sea surface, some researchers tried to calculate the bathymetric profile in shallow water using satellite multispectral images. The development of different algorithms and image processing methods led to the birth and success of the discipline called Satellite-Derived-Bathymetry (SDB). The results were good but the big issue was the low resolution of satellite images that prevent the production of high quality cartography.
MAIA WV is the multispectral camera developed by SAL-Engeneering, Eoptis and Fondazione Bruno Kessler in order to achieve big results in proximal sensing. The camera permits to acquire high resolution multispectral images in different bands of VIS and NIR electromagnetic spectrum regions.
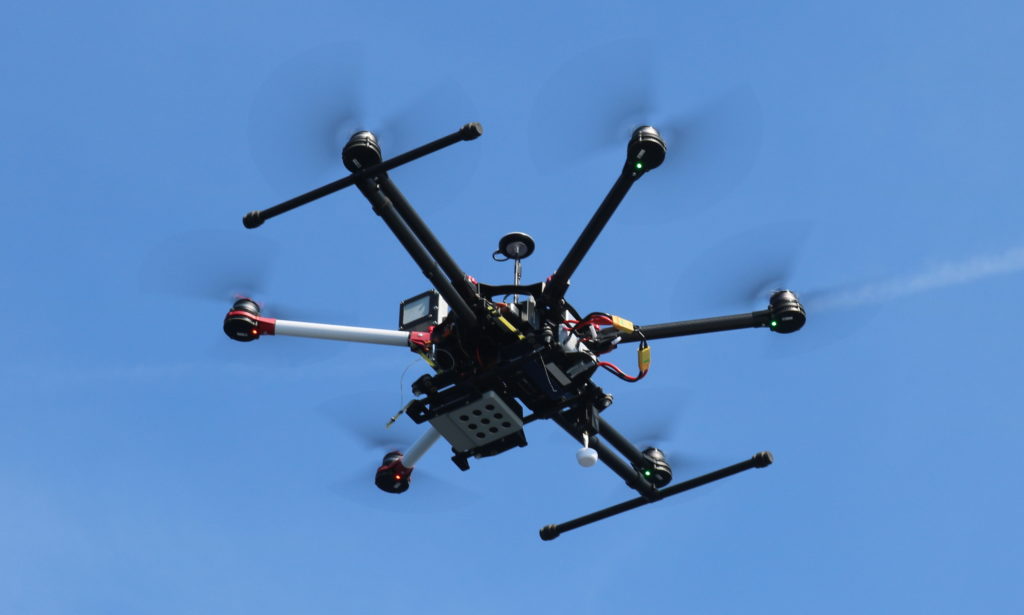
MAIA WV multispectral camera is equipped with the same wavelength intervals of the DigitalGlobe WorldView-2™ satellite. The purpose of this research is to apply the algorithm used for the satellite images to extrapolate the 3D model of shallow water seabed using MAIA WV multispectral camera, and produce seabed cartography with high resolution, keeping the costs of the operations below the threshold of a traditional bathymetric survey. The research was conducted on May 27, 2019 near La Ciotat, a french commune in Bouches-du-Rhône department, 40km east of Marseille. The camera was mounted on a DJI-S900 UAV through personalized support and three flights were performed in different time of the day to evaluate the various condition of sun light. Approximately 300 images per flight were taken. The radiometric correction of the MAIA WV images was performed with the ILS (incident light sensor) mounted onboard UAV. The images were taken from 100 m above the sea surface with a ground sampling distance on the sea surface of ~5cm. MAIA WV camera takes images of 1.2 Mpixel in each band.
A difficult part of this research was the operation of geo-referencing and merging the images to create the mosaic of water surface.
It was also necessary to correct the sun glint: this issue was caused by the sunlight reflection on the water surface that produce a saturation of reflectance value in some pixels of the image. Problems related to geo-referencig and mosaicking force us to apply some approximation in the model. The images was georeferenced using the GNSS data acquired by the antenna mounted onboard UAV: these coordinates was not really accurate and this was the cause of some important error in planimetric positioning.
To avoid this error, where the seabed morphology was clearly visible, some images were manually georeferenced using as a reference some target located on the shoreline: this process can reduce the positioning error especially in the area near the shoreline.
The final model was created at a resolution of 50 cm to fit the model to the reality and to smooth the error.
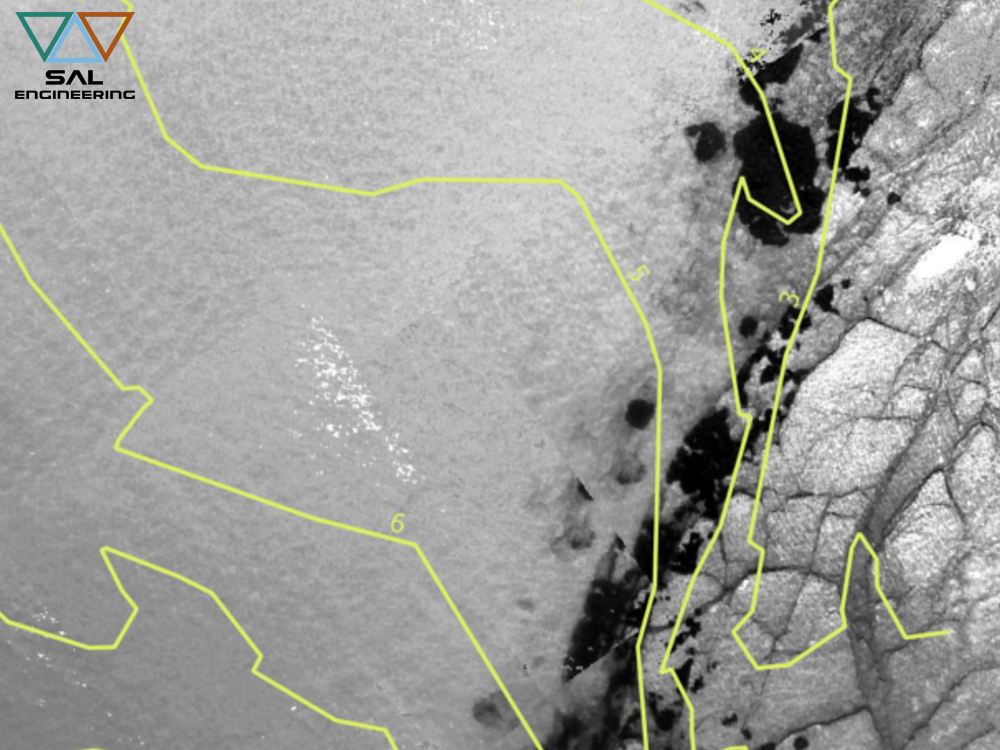
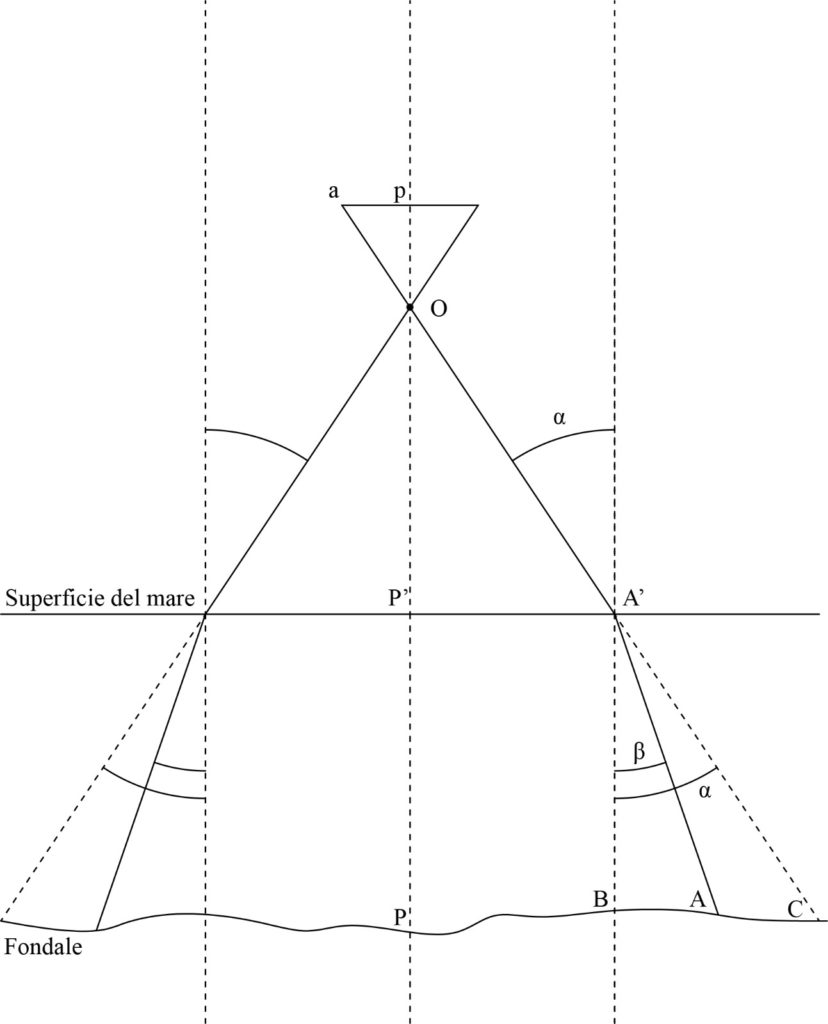
The chosen algorithm to derive the bathymetry was developed by Stumpf (2003). This algorithm use a two band ratio equation where the different absorption of the bands in water is exploited to derive the water depth. The Stumpf algorithm requires some control point to scale the ratio to depth. Due the different seabed morphology it has been decided to split the model in two part, an area of open sea in the middle of the bay and an area near the reef where the seabed features are clearly visible.
Images have been georeferenced using data derived from GNSS positioning system onboard UAV. Given that images were taken 100 m above the water surface, it derives that images are georeferenced on the surface of the sea, which is assumed to be flat, horizontal and at the orthometric altitude equal to zero, a choice that we know to be remarkably approximate.
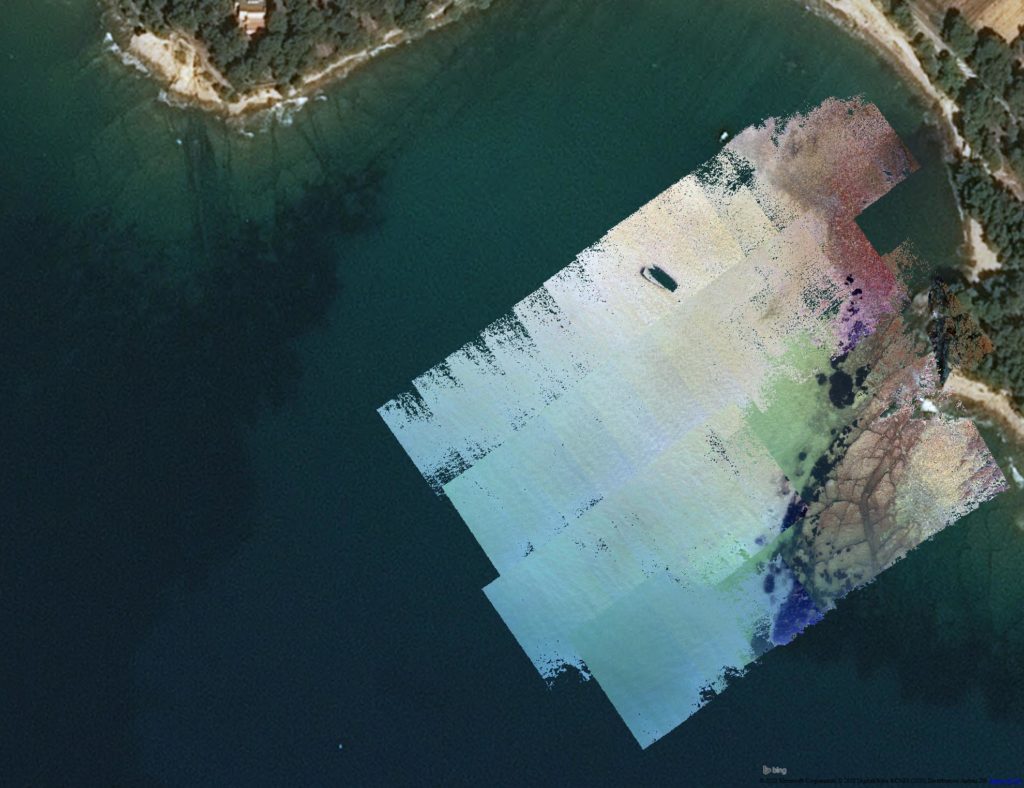
Multiband mapping of the orthomosaic obtained. RGB: 3-2-1.
This is not correct also because the images return the sea bottom actually and not the water surface. To correct this issue an iterative georeferencing processing in GIS has been implemented. Then, it has been applied the Stumpf algorithm on the mosaic to obtain the depth model, and then, using this model, the images are re-projected on the sea bottom considering the distortion caused by the water refraction. Finally, with this new corrected images it has been re-created the mosaic and re-applied the algorithm to obtain the final model.
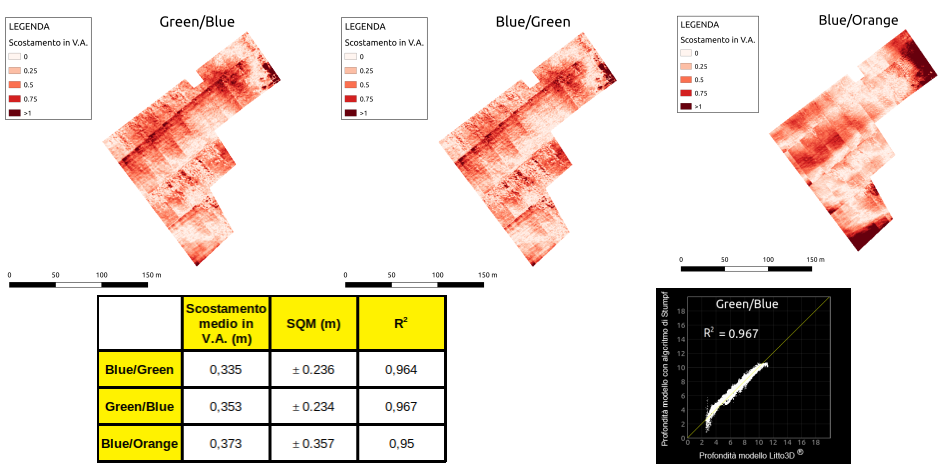
As mentioned above, the model has been splitted in two areas, the ratio algorithm has been applied in both the areas using different combination of bands (Blue/Green, Green/Blue, Blue/Orange). Green/Blue is found to be more suitable for estimating bathymetry in the open sea, while Blue/Orange was more suitable for estimating bathymetry in areas with less depth and with a more diversified morphology in the seabed.
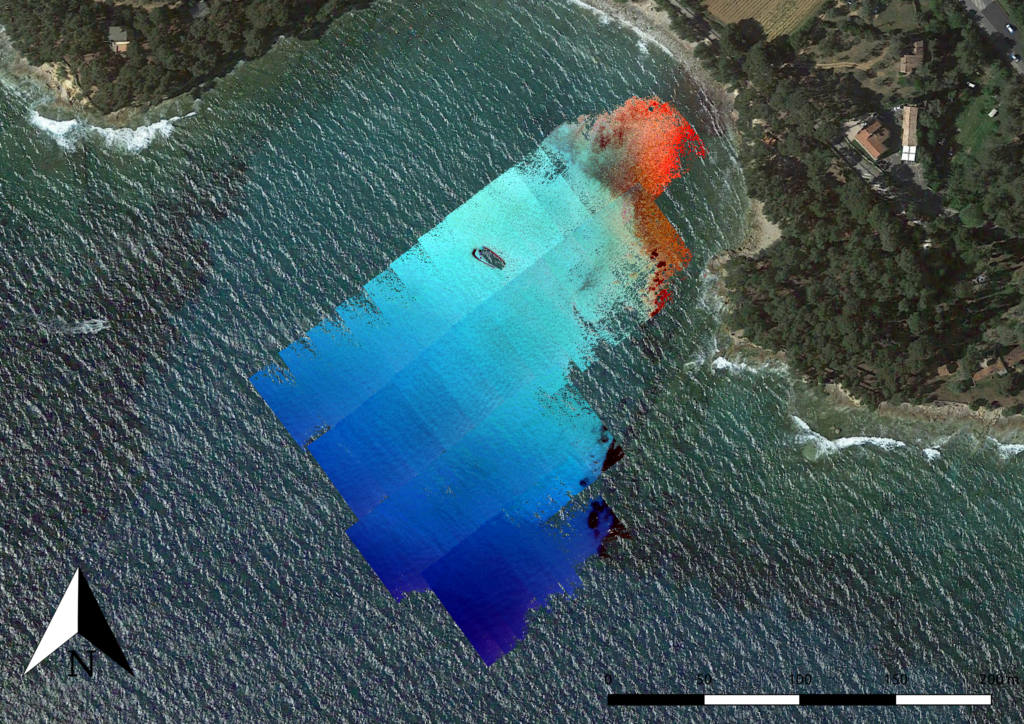
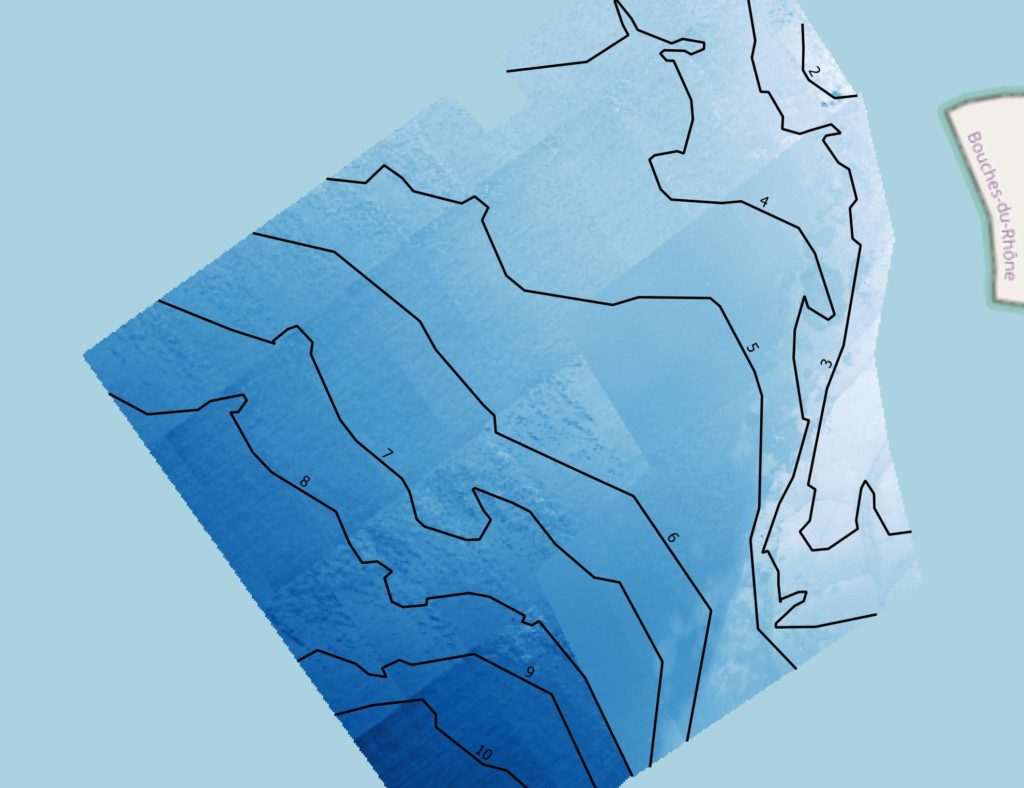
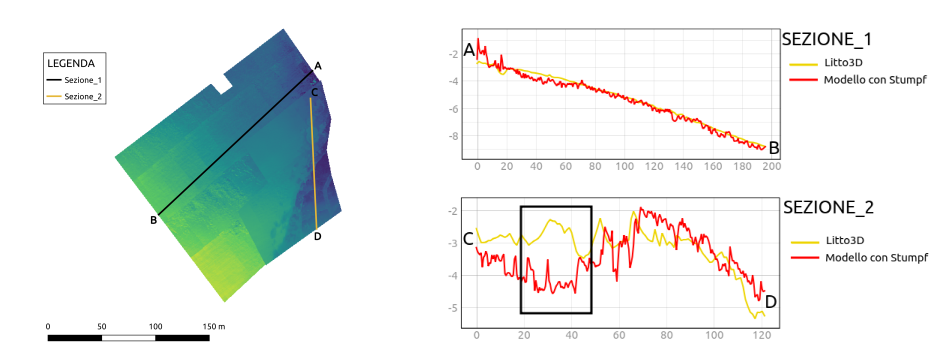
Depth model plus isobaths 1 m.
The reference model which to validate our result with, is available online from SHOM (Service Hydrographique et Océanographique de la Marine). The reference model was created into the LITTO3D® project by a airborne bathymetry lidar.
We can see an offset in absolute value (A.V.) between our model and the reference model of ~0.34 m in ratio Blue/Green and Green/Blue with a standard deviation (SD) of ±0.23 m. If we consider the resolution of our model (50 cm) we can assert that this is a good result (we must not forget the error caused by low accuracy GNSS positioning) for estimating bathymetry in shallow water.
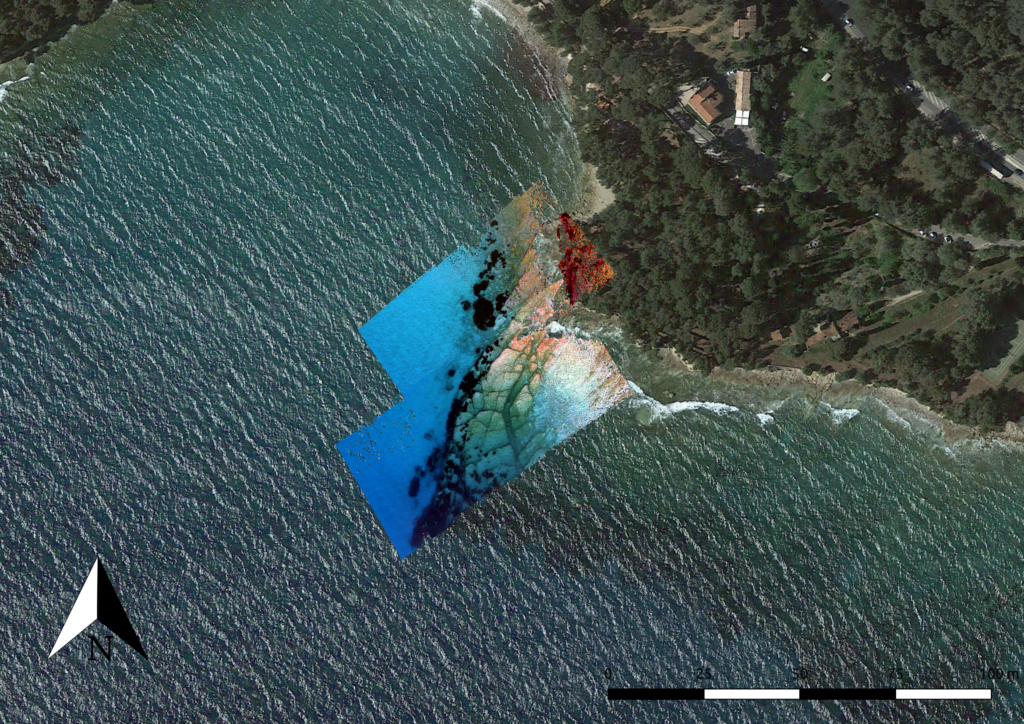
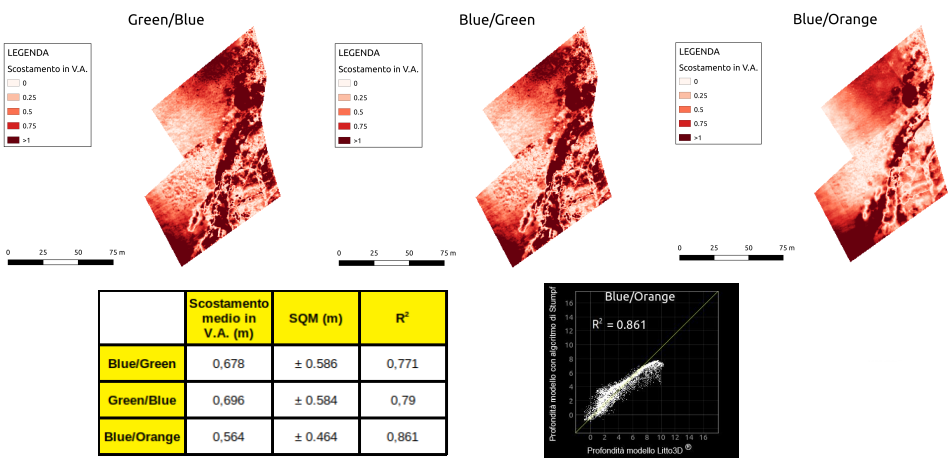
In the other area, where we can see the irregular seabed morphology and some seagrass meadows, the results are a little worse. Here the best result is from Blue/Orange ratio and we can see an A.V. offset of 0.56 m with a SD of ±0.46 m. We must consider that the seabed heterogeneity emphasize the GNSS positioning error.
This result can be observed even in the seabed profiles extracted from the depth model. There are issues in the areas of shallow water and where we have some seagrass meadows. The algorithm is more sensible to the bottom albedo where the water is shallow and also where the seagrass causes some absorption variation.
In conclusion, we can asset that is possible to use MAIA WV multispectral camera for bathymetric survey. This methodology must be implemented in future and a lot of errors can be fixed but we are sure that this is an important step to develop this methodology and technology.
A comparison between UAV and high-resolution multispectral satellite images for bathymetry estimation
We proudly share this interesting study on the application of multispectral survey to the bathymetric depth estimation. The study was carried out by Italian professionals in the field of remote sensing and geomatic survey using our multispectral camera MAIA WV, which has 8 bands with the same wavelength intervals as Digital Globe’s WorldView-2 satellite. The study led to the estimation of the depth and bathymetric trend of shallow seabed close to the coast. Here is the abstract of their publication with AIT – Italian Association of Remote Sensing.
Shallow water bathymetric surveys support Integrated Coastal Zone Management and Maritime Spatial Planning, e.g. in coastal erosion monitoring, shore protection design and landfall projects oil and gas pipelines. High-resolution multispectral satellite imagery, such as Quick Bird and Worldview, are increasingly used for this purpose. The present study shows the results of a comparison between high resolution satellite and Unmanned Aerial Vehicle (UAV) derived bathymetry. Accuracy was validated through an hydrographic survey performed with a Multibeam Echosounder (MbEs) at the same time of UAV acquisition. The drone was equipped with a small and light multispectral camera, acquiring in the same WorldView-2 sensors spectral bands. The study area, located in the central Tuscany coast (Italy), is approximately 0.5 km2. Because of the high percentage of water present in UAV images, a new method was implemented to produce a georeferenced orthophoto mosaic. Multispectral images were processed to retrieve bathymetric data with Stumpf’s algorithm. Different pairs of bands were tested to determine the best fit for real water depth data. The influence of sea bottom control points density on data accuracy was also analyzed. Results show the possibility to produce accurate remote sensing bathymetric maps with low operational costs and easy data processing, giving the chance to set up shallow water monitoring programs based on UAV surveys. A further advantage of this method is the capability to produce a full sea-floor
coverage bathymetry in very shallow water areas, were MbEs is usually unable to work properly and to represent the aerial option to survey very shallow waters alternatively to Unmanned Surface Vehicles (USV) a.k.a. ASV (autonomous surface vehicles).
Multispectral data for environmental investigations
SAL Engineering, in collaboration with ARPA Campania, carried out some experimental multispectral investigations to research the possibilities of development of the multispectral survey technology applied to environmental monitoring.
The University of Modena and Reggio Emilia has also conducted studies, research and insights on the data obtained, also through the thesis of Dr. Lisa Mosconi. The purpose of this thesis is to investigate the potential and problems related to the use of multispectral images acquired by sensors mounted on board of remotely piloted aircraft (APR), also called more commonly drones, for applications of environmental sciences and environmental protection.
These sensors are sensitive to radiation emitted or reflected on different wavelength intervals of the electromagnetic spectrum, from the visible region (VIS) to that of the near infrared (NIR) and it is precisely this ability to observe beyond the visible, side by side of the ‘high geometric resolution that can be obtained, which makes them particularly interesting for environmental investigations. The acquired data allow to obtain information regarding the stress or vigor of the vegetation, aspects that can also be correlated to other information depending on the territory considered.
The term “environmental investigations” therefore refers to a series of applications that include precision agriculture and the monitoring of portions of the territory affected by problems of soil and groundwater pollution.
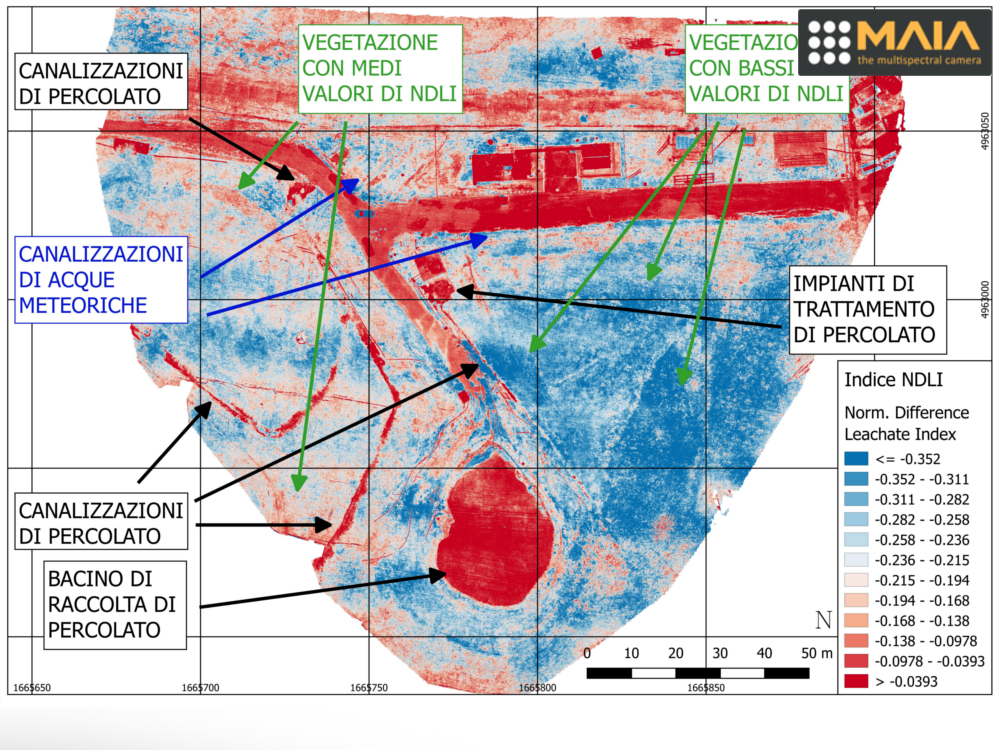
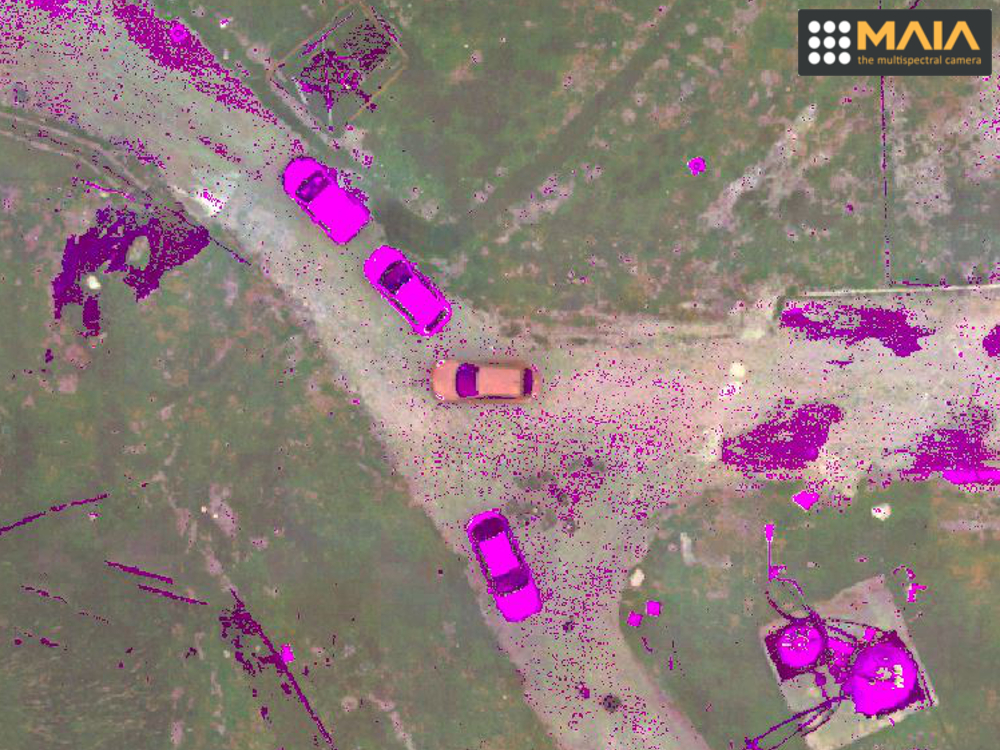
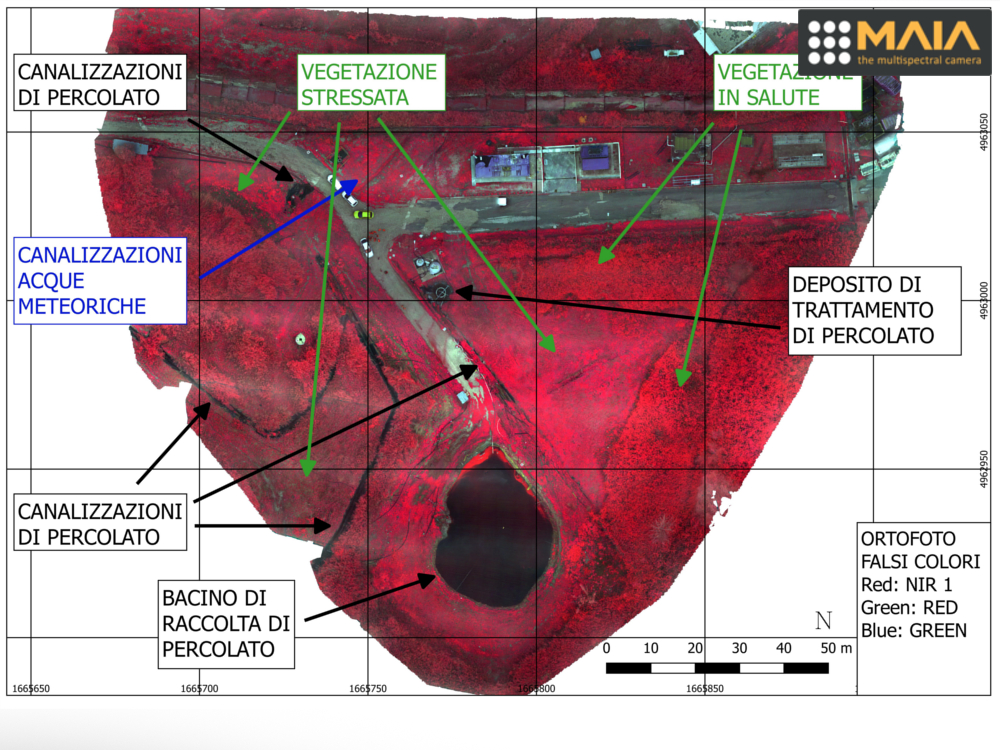
In a waste disposal plant, the multispectral survey provides geometric and radiometric information useful to identify and diagnose any malfunctions in the management of wastewater and sewage produced by the decomposition of waste, to characterize the various infrastructures of the plant, to diagnose any phenological consequences and pathological effects on vegetation affected by contamination processes. In addition, it is possible to evaluate the presence or absence of a pollution by leachate inside the pipes and the surrounding soil.
All this was possible thanks to the innovative MAIA multispectral camera developed by SAL Engineering together with Eoptis mounted on board a multirotor drone, which allowed the acquisition of multispectral images, with a degree of detail and accuracy never achieved before.
“Quantitative Remote Sensing at Ultra-High Resolution” on Remote Sensing journal
“Overall, we expect that UAV spectral sensing systems will become common in the toolbox of researchers in quantitative remote sensing, forestry, agriculture, field phenotyping, ecology, and other fields that rely on environmental monitoring. […] In combination with commercially built fixed-wing or rotary-wing UAVs, these cameras are becoming a powerful tool for researchers, as their rapid adaption shows, but also for service providers, breeding companies, and even farmers”.
We are happy that our work of design, study, experimentation, data acquisition and processing is leading to great satisfaction in the world of scientific research. In the paper linked below and published on Remote Sensing journal, you can read a review of the most important technological innovations regarding the high resolution multispectral survey. And MAIA is certainly counted among them.
“The important tasks now are to standardize procedures, develop algorithms, and explore the
potential to make use of the large amounts of multi-dimensional, high spatial, temporal, and spectral resolution UAV data. In this review, we showed that many approaches exist, and identified best practice procedures to derive calibrated spectral data from UAV sensing systems”.
You can read and download the paper by clicking on the link below.
Multispectral survey of turf and grass cultivation
The specialized branch of agronomy that deals with the production and maintenance of turfgrass, characterized by a very high technological content, and where important contributions are at stake to ensure the excellence of the cultivations, has certainly not missed the potential offered from the multispectral survey, for the in-depth knowledge of the biological, chemical and physical phenomena that characterize the plots.
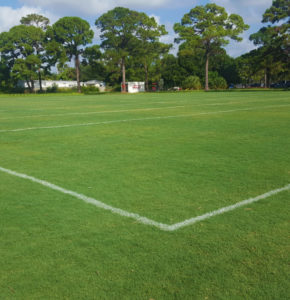
Natural grass in a football pitch.
High quality grassy meadows, such as golf courses, soccer fields or gardens, require a significant supply of water and nutrients, as well as intensive maintenance. It is certainly an area of employment characterized by high maintenance costs, where particularly efficient management is required. In particular, it is increasingly important to plan the agronomic management of the turf industrial cultivation in such a way as to make it as site-specific as possible. Within the plots, it is important to map the phenological variability and the diversification of the interventions, with a view to the sustainability of the cultivation from an economic and environmental point of view.
The applications of the multispectral survey are experiencing great technological development and great interest mainly because they are addressed to the in-depth knowledge of the environmental reference matrix (vegetation, soil, water) with a view to productive efficiency (variability mapping), environmental sustainability (site agronomic intervention), to rationalizing the use of natural resources (monitoring of water supply and location of deficiencies), environmental protection of ecosystems (protection of biodiversity), but above all with a view to the safety of environmental services (monitoring quarries and landfills), settlements (hydrogeological risk) and food products (eco-sustainable agricultural production).
Agriculure and Forestry
· Water supply management
· Rationalization of pesticide
· Variable fertilizer distribution
· Yield estimation and comparisons
· Prevention of critical pathologies
· Classification of species
· Protection of ecosystems
Environmental monitoring
· Spill control in water bodies
· Bathymetry of shallow waters
· Control of drains in soils or water bodies
· Classification of polluting materials
· Control of quarries and landfills
· Mapping of leachate flows
· Identification of illegal landfills
Industrial sites
· Classification of materials in deposits
· Inspection of industrial waste
· Inspection of industrial plants
· Inspection of spills and roofs
Geology
· Soils classification
· Physical-chemical characterizations of soils
· Mapping of soil compaction
· Mapping of paleo-river beds
The vegetative trend of the turf, linked to seasonal climatic conditions, can be monitored through multispectral survey and vegetation indexes, in correlation with the data acquired from other sensorial platforms on the ground, to estimate the nitrogen fertilization requirements, to evaluate the effects of mowing, and to plan irrigation flows and methods (sub-shallow drip irrigation or spray irrigation).
The conditions of vegetative stress of turf, fungal attacks, water shortages must be diagnosed promptly with data acquisition systems that provide tools and information more detailed and useful to the green keeper. Within a competitive market, and attentive to environmental sustainability, it is no longer sufficient to regulate fertilizers and interventions on the basis of visual analysis, nor those simple diagnostic tools of instantaneous detection, which photograph the state of health, reporting the NDVI index values, often in an unreliable and inaccurate manner.
Thanks to new sensor-based proximal sensing technologies installed on board remotely piloted aircraft, it is possible to map the variability inside the turf farms, in golf courses, in soccer fields and in gardens, obtaining useful and above all rigorous cartographic products from the geographical, geometric and radiometric point of view, with great efficiency in terms of time, cost of the survey, precision and accuracy of the products, with an important added value about the agronomic knowledge of the crop.
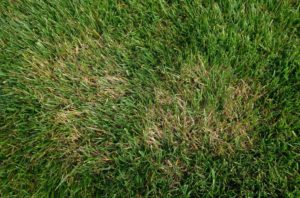
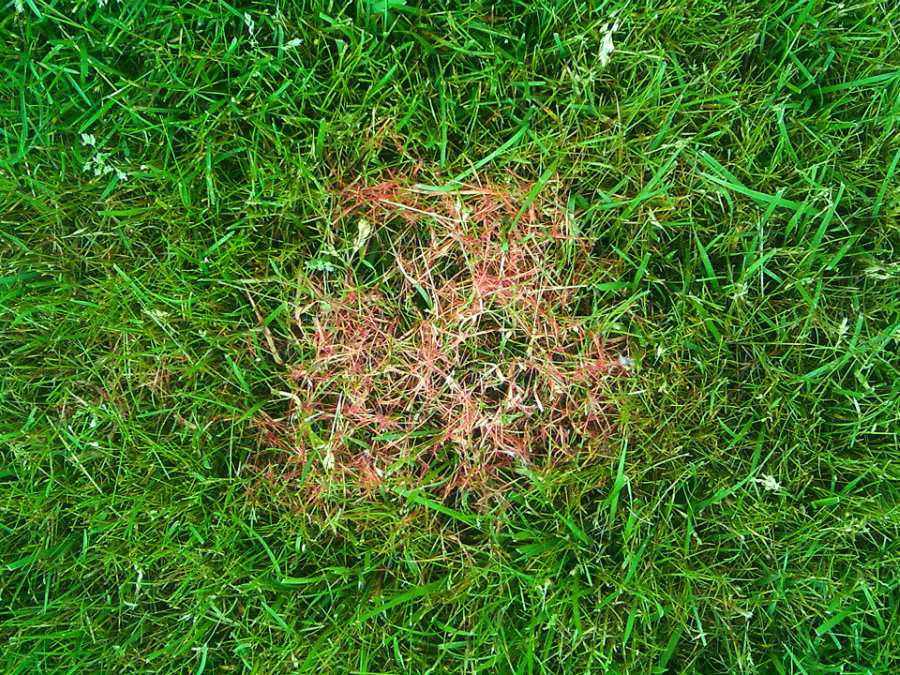
Brown patch (Rhizoctonia solani), a disease that presents with circular brown spots on the turf.
The know-how of the agronomist, or better in this case of the green keeper, who knows the critical aspects of the plots and traces the interventions carried out, is fundamental in the multispectral survey planning phase, because according to his indications the survey will be set such a way to obtain cartographic products with a specific geometric resolution (choosing the ground sample distance of the digital maps) and spectral (choosing to use a camera with certain wavelength ranges), but above all its analysis of the obtained data and of the indices calculated will be strategic to decide the agronomic interventions to be implemented on the grass.
Rhizoctonia solani is a typical disease of hot and humid periods and its development is favored by an excessive nitrogen fertilization as well as by too frequent irrigations. Agrostide, lolium and festuca arundinacea are the most susceptible species; poa and fine fescues (rubra and ovina) are very resistant.
Indexes calculated on the multispectral data, as we read in the scientific literature, are variously correlated to the visual quality measurements of the discipline that studies grassy surfaces, such as density, texture, uniformity, color. These specific indices are also used to assess the effects of prolonged trampling, periods of water shortage, and different mowing methods. Other calculations between the reflectances of certain bands can instead estimate the need for certain nutrients in a specific vegetative phase. For example, if a comparison is made between two multispectral surveys shortly before mowing and immediately after mowing, it is highlighted by many that mowing affects the data collected for all visible bands with a constant increase of around 4%, but, moving to the near infrared, this increment is not recorded (Sullivan, Dana & Zhang, Jing & R. Kowalewski, Alexander & B. Peake, Jason & F. Anderson, William & Waltz, Clint & M. Schwartz, Brian. 2017). Consequently, those vegetation indexes that normalize the reflectance of the infrared on the reflectance of the red, as the most common NDVI (Normalized Difference Vegetation Index), will also drop immediately after mowing.
For these purposes, and as we will see later, it is essential to use a multispectral survey instrument that allows to investigate the turf at wavelengths distributed along the whole electromagnetic spectrum that from violet reaches the near infrared, to have the possibility to calculate indices that not only consider the red or near infrared band, but that can provide useful indications with a complete spectral screening of the culture. Very important is also the control during the extraction and processing of the geometric and radiometric data of the images that the multispectral camera acquires.
The ideal, in this type of application, is a multispectral camera which completely covers the electromagnetic spectrum from Visible to Near Infrared, and which has narrow-band configurations in certain wavelength values, such as in the Red Edge or in Near Infrared, to be able to investigate specific phenomena of photosynthetic activity, the presence of particular elements and the occurrence of physical or chemical phenomena related to vegetative development.
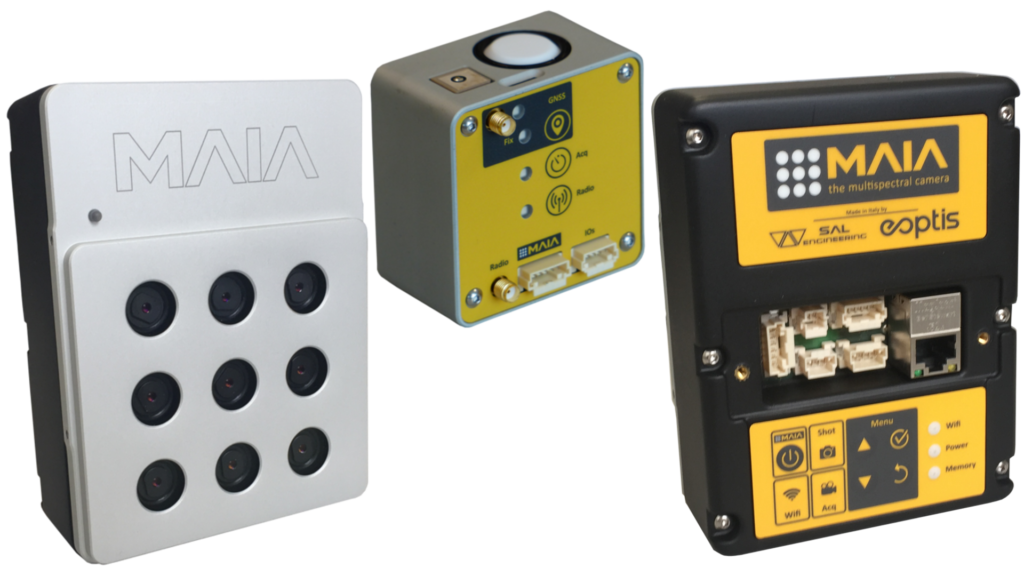
MAIA multispectralcamera + ILS – Incident Light Sensor
The MAIA Multispectral Camera can be used on board RPAS (Remotely Piloted Aircraft Systems, better known as drones or UAVs, Unmanned Aerial Vehicles), airplanes and land rovers in multispectral survey operations. MAIA is composed of an array of 9 1.2 Mpixel sensors (9 monochrome sensors with real band-pass filters in the MAIA S2 filter-set, and 8 monochromatic plus 1 RGB in the MAIA WV filter-set) to acquire images in the VIS-NIR spectrum. MAIA WV has the same wavelength ranges as DigitalGlobe’s WorldView-2™ satellite, from 433 nm to 950 nm. MAIA S2 has the same wavelength ranges as ESA’s Sentinel-2™ satellite, from 433 to 899.5 nm. It is a project of the highest technological value entirely Made in Italy.
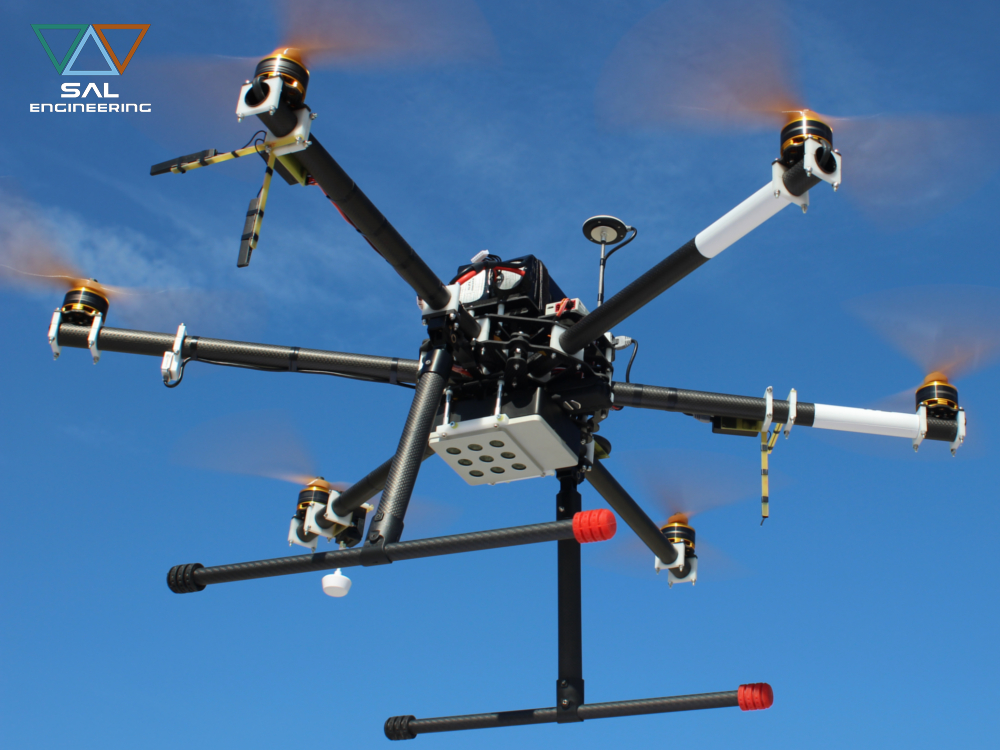
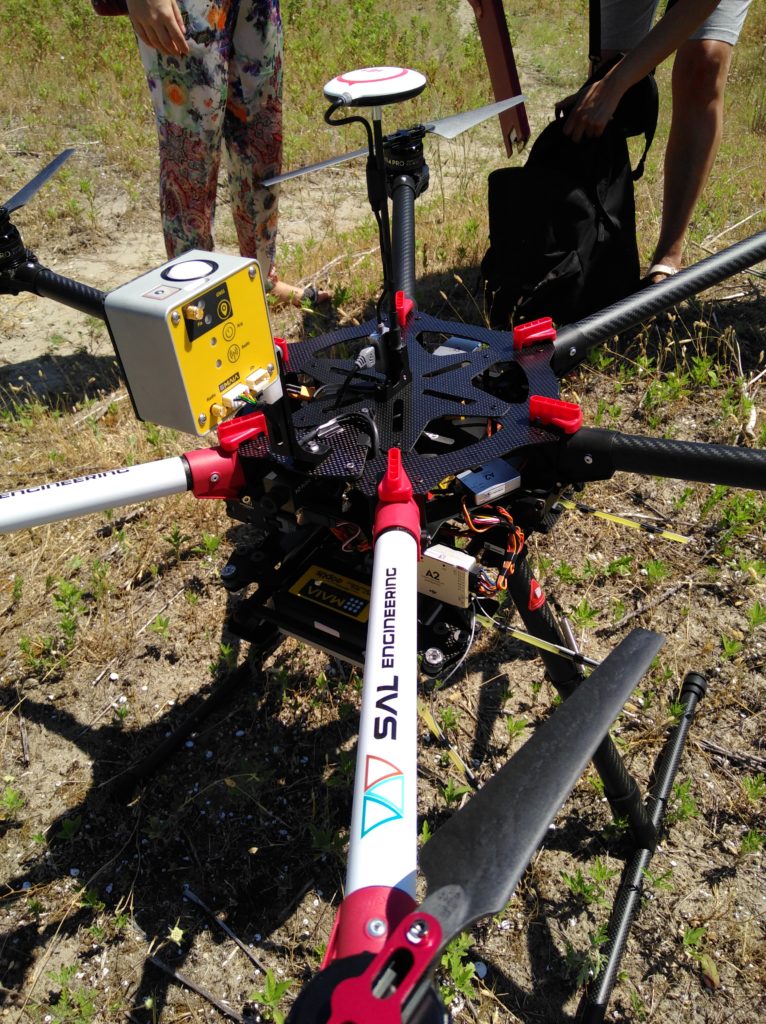
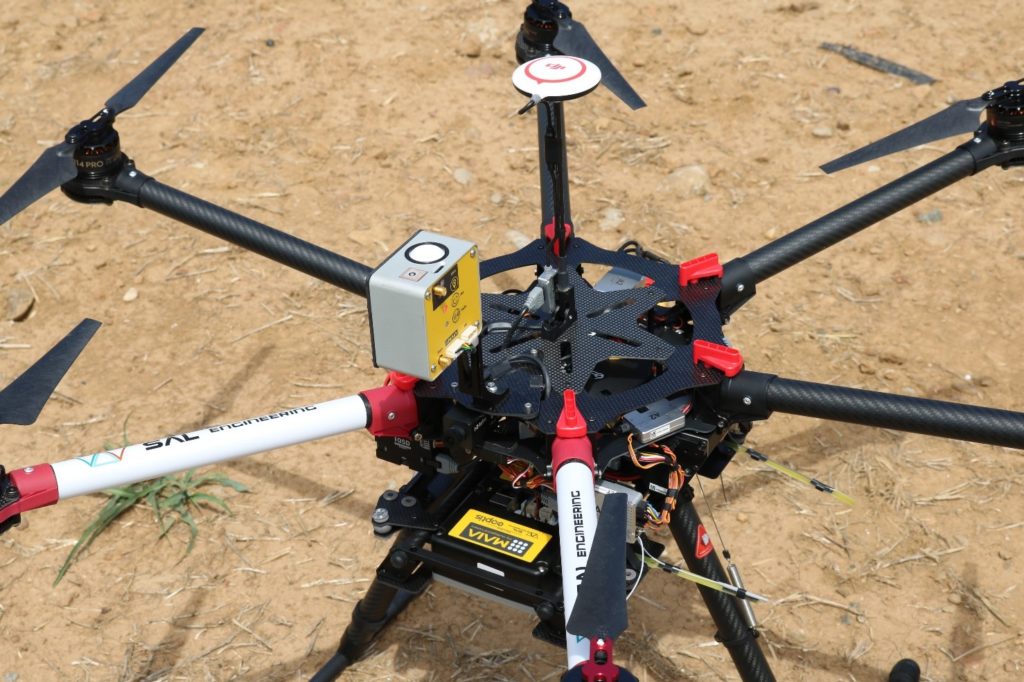
SAL Engineering UAV SP001 equipped with MAIA.
The CMOS sensors installed in MAIA have excellent characteristics in terms of sensitivity; the resolution is 1280×960 pixels and the size of the sensor pixel is 3.75 μm x 3.75 μm; each sensor is Global Shutter and acquires simultaneously: it follows that it is not necessary to stabilize the shot with a gimbal, which instead remains indispensable with rolling shutter sensors to avoid distortions and blurred pixels in the image. The high quality and radiometric correctness of the data obtained with MAIA are therefore guaranteed even in high speed flights. Each optics, of every MAIA built, is calibrated in the laboratory by 3DOM – Fondazione Bruno Kessler, and for each device the Calibration Certificate is available, with the following parameters:
calibrated focal length;
position of the main point;
lens distortion parameters.
The user can interact with the camera to configure acquisition operating parameters and to manage images either via a GigaEthernet port or via integrated WiFi. Many parameters can also be configured via the keyboard using the On Screen Display in the composite video output. Thanks to a web panel, MAIA allows a precise adjustment of all the parameters concerning the acquisition, from the exposure time to the shutter frequency, while automatic configurations are available for standard operations.
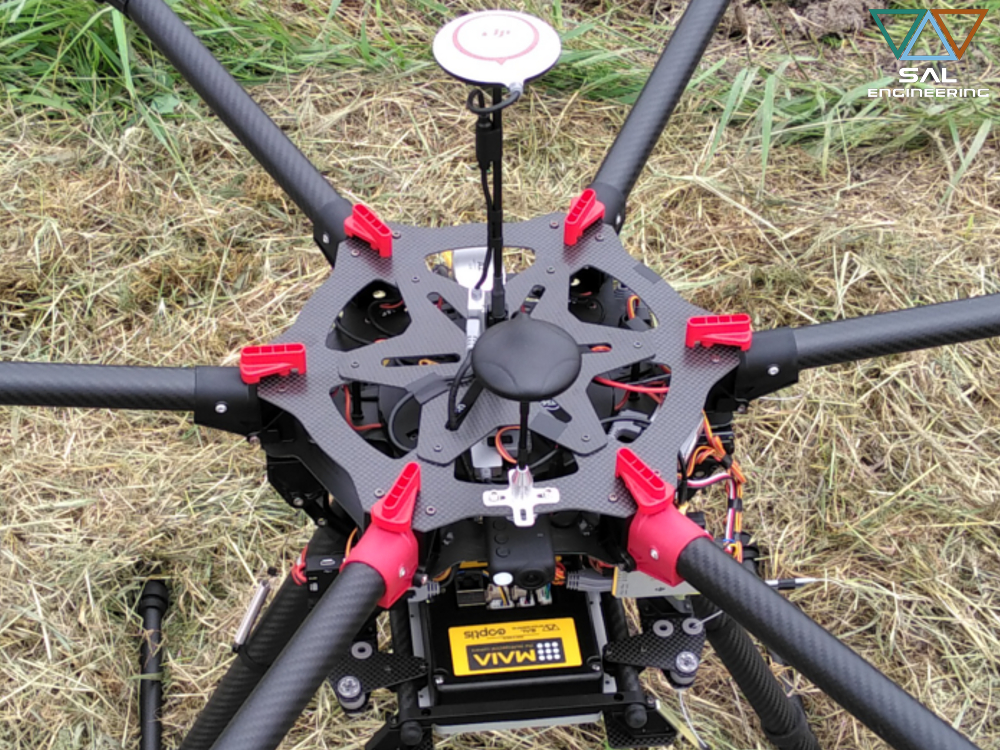
DJI S900 UAV equipped with MAIA
MAIA can communicate and be interconnected with different devices:
GNSS: GPS L1 or L1 / L2; GLONASS, Galileo, Beidou, to obtain a log file with the positions of the synchronized shots (available in PPP, PPK, RTK);
VIDEO TX for real-time transmission of images from each sensor, even remotely;
RDX for remote control of the Camera (frame rate, selection of the video source, activation of the Wi-fi);
GIMBAL for orientation, displacement and balancing control (an IMU integrated with 3 accelerometers and 3 gyroscopes provides orientation parameters).
The images acquired by MAIA are saved on an internal hard disk (120Gb SSD) which ensures high writing speed and the possibility of saving up to 10,000 images in 12-bit format (MAIA acquires 8-bit, 10-bit and 12-bit images).
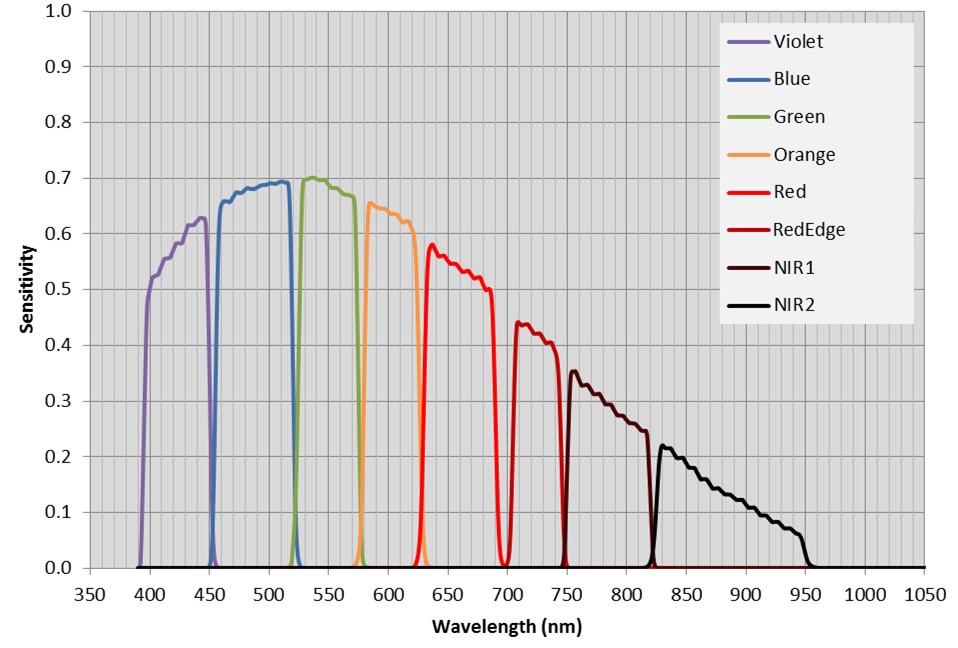
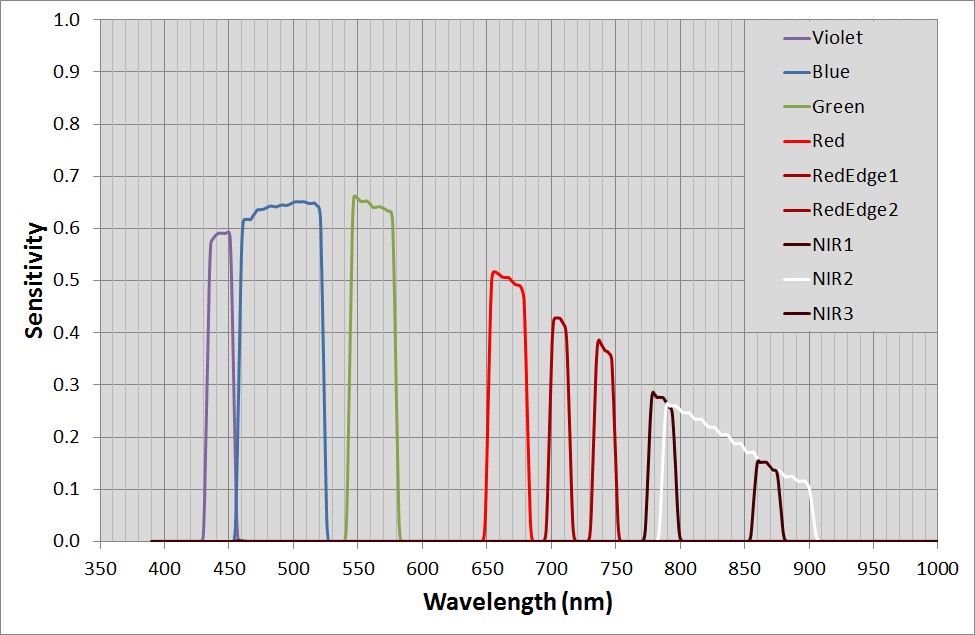
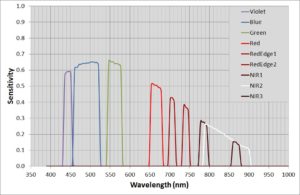
MAIA WV, as mentioned above, consists of a RGB sensor to obtain images with real colors, and 8 monochromatic sensors with sensitivity in the VIS-NIR spectrum from 390 nm to 950 nm. Monochromatic sensors are coupled with band-pass filters which determine the wavelength intervals that can be investigated, as shown in the following graph.
MAIA WV amplitude and distribution of wavelenght intervals
MAIA S2, on the other hand, is the multispectral camera with 9 sensors designed and developed to have 9 bands with the same wavelength ranges as the European Space Agency’s Sentinel-2™ satellite. Each sensor has a resolution of 1280×960 pixels (1.2 Megapixels) and the size of each sensor pixel is 3.75 μm x 3.75 μm. Monochromatic sensors are coupled with band-pass filters which determine the wavelength intervals that can be investigated, as shown in the following graph.
MAIA S2 amplitude and distribution of wavelenght intervals.
The products of the multispectral survey carried out with the MAIA multispectral camera are therefore multilayer or multichannel images corrected for radial and geometric distortion, and with the pixel-based co-registration of the radiometric information for all bands.
DJI S900 equipped with MAIA and ILS – Incident Light Sensor
This is done by MultiCam Stitcher Pro, the software for extracting and processing images acquired with MAIA developed by 3DOM – Bruno Kessler Foundation, with which it is possible to operate the radiometric correction of multispectral images, to obtain the correct reflectance data, repeatable and comparable in different environmental conditions.
For this purpose, SAL Engineering and Eoptis have developed and patented ILS – Incident Light Sensor, an incident light sensor that records the incident and diffused environmental radiation at the time of each single shot, to conduct the radiometric correction of the multispectral data based on the conditions of real and contingent electromagnetic energy. In addition, ILS has a 6-axis inertial platform for orientation data, an environmental sensor for obtaining atmospheric pressure, temperature and humidity data, and has a GNSS receiver for geo-referencing the acquired images, also available in an RTK version for centimetric positioning accuracy. All the parameters measured by ILS are automatically recorded in a log file related to the set of images acquired, and are immediately ready for the pre-processing operations with MultiCam Stitcher Pro.
On the basis of the instructions and the operational needs of the green keeper, the multispectral survey carried out with MAIA can provide images acquired at such a level as to ensure the presence of the entire plot under investigation in the frame: on this image can be operated a flat projective transformation, thanks to the measurement of the coordinates of some markers present in the scene. Thanks to the image pre-processing software, calculations can be performed directly on the images, to obtain indexes that, with agronomic technical supervision, become a fundamental tool for the preventive diagnostics of turf pathologies and for their monitoring. For larger plots, on the other hand, it is advisable to obtain a georeferenced multispectral orthophoto from the alignment of multiple images acquired with photogrammetric strips and from the 3D model created by photogrammetric processing software.
With reference to satellite images and images obtained by proximal sensing, a great deal of academic research is underway on the formulation of indexes and calculations between bands for the agronomic study of different crops (and among these, also of grassy coverings). Equally important is the transformation of vegetation indices into prescription maps, to direct the agronomic intervention in the field.
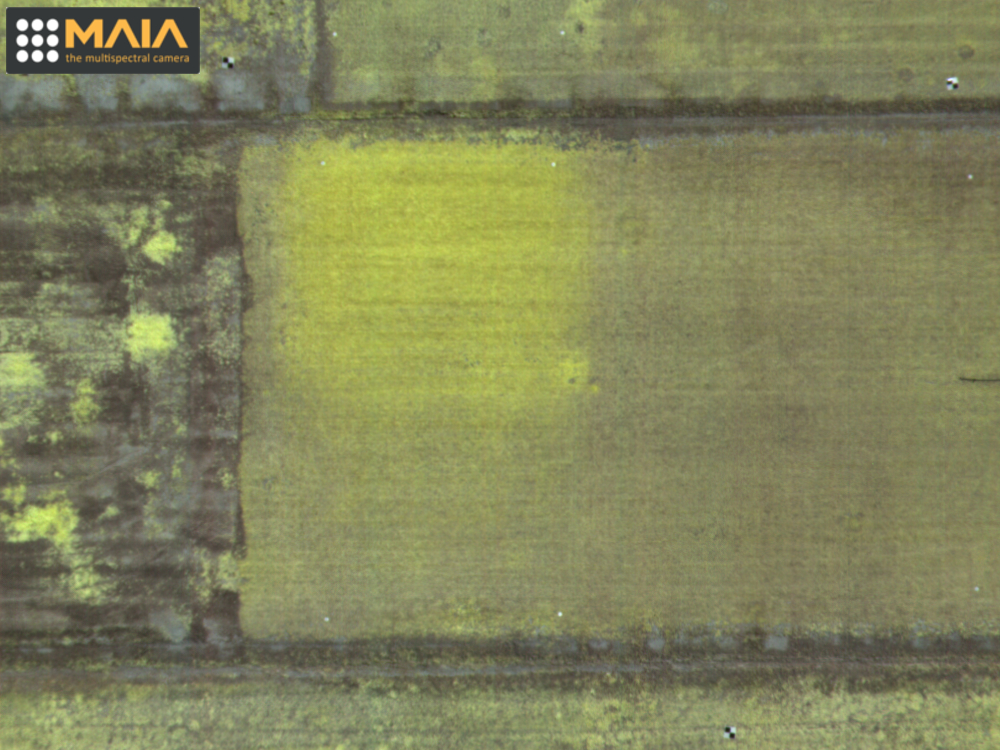
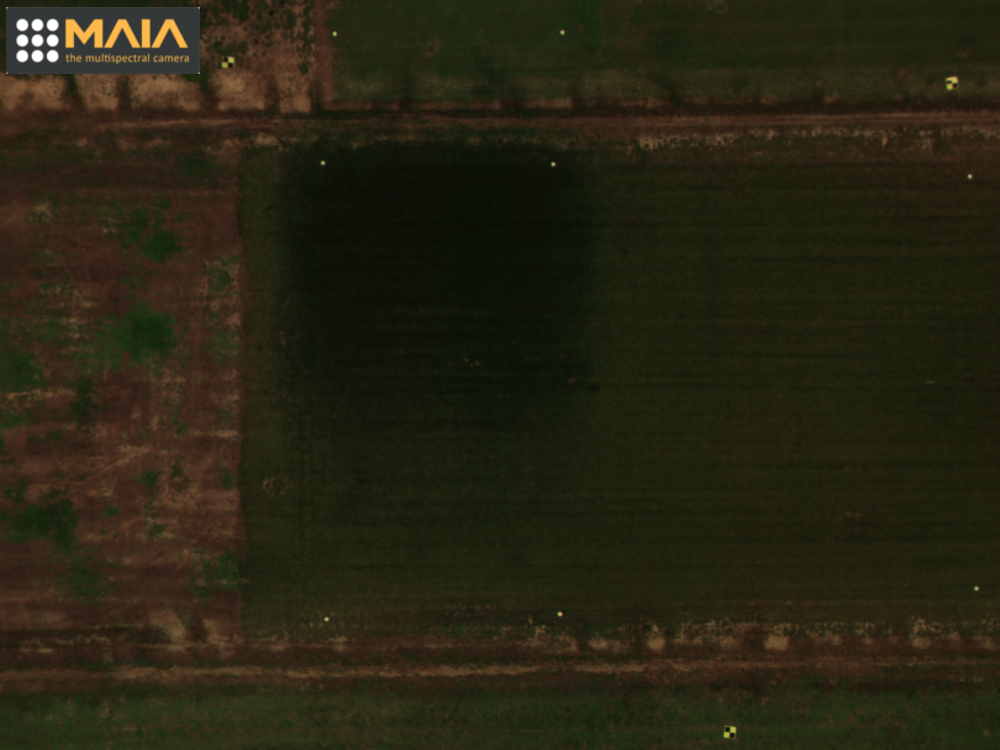
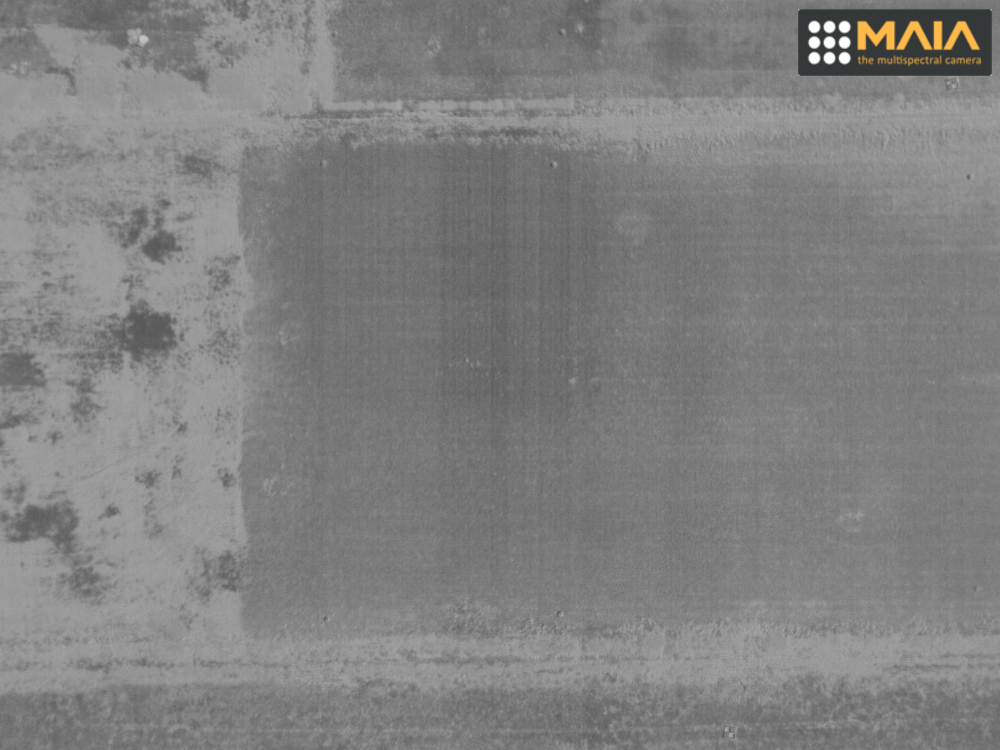
RGB combination in real colors (RGB = 532 – MAIA WV) after correcting geometric and radial distortion and after radiometric correction, of a plot in an intensive cultivation of turf. The image was acquired at an altitude of 25 m AGL (GSD: 12 mm / pixel) on a day with a clear sky in July 2017.
SAL Engineering, together with various operators in the sector, is involved in the research activity for the study and application of indexes and calculations on the single image or on the multispectral orthophoto obtained from the survey carried out with MAIA. Since July 2017, and then in the following years, several acquisitions were carried out using the MAIA WV filter-set in a turf farm, in a golf course and in a soccer field in Tuscany, for evaluate the contribution of the different data acquisition technologies within a monitoring and management plan for industrial cultivation and turf maintenance.
In these portions, together with the multispectral survey, measurements were carried out with technologies and methodologies typical of agronomic studies on turf, and above all agronomic interventions were traced. Scientific research is still in progress: we will limit ourselves here to the presentation of some vegetation indexes that are applicable to the diagnosis of turf according to scientific contributions in literature.
Below an image acquired in a turf farm, on which several multispectral indexes have been applied to enhance phenomena on the turf. Here is a sample list of indexes calculated:
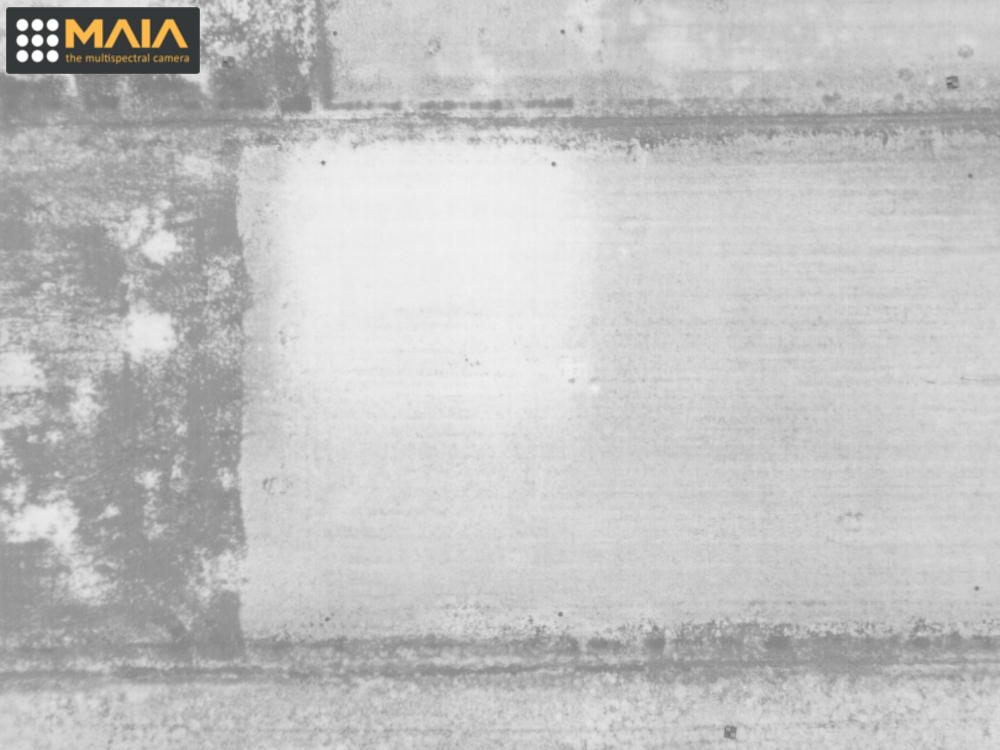
NDVI (Normalized Difference Vegetation Index – (NIR-Red)/(NIR+Red)) – MAIA was developed with the intention of providing a functional tool for in-depth knowledge of crops thanks to the precise definition of the red interval and the differentiation in different bands of the Red Edge and NIR (Near Infrared) in order to perform differentiated calculations in the study of vegetation health and in order to normalize the most studied, widespread and applied vegetation indexes calculation on the reflectance of other wavelength ranges, such as blue, green and violet. In the next images, where not explained, the lowest values are those that tend more to black, while the higher values tend to white.
Index NDVI (MAIA WV) after correction of the geometric and radial distortion and after radiometric correction, of a plot in an intensive cultivation of turf. The image was acquired at an altitude of 25 m AGL (GSD: 12 mm / pixel) on a day with a clear sky in July 2017.
NDRE (Rededge Normalized Difference Red-Edge – (NIR-RedEdge)/(NIR+RedEdge)) – This index is very sensitive to the chlorophyll content in the leaf apparatus; it is also very useful for extracting the vegetative part from the underlying soil and for limiting the effects of the soil on the datum of reflexivity relative to the foliar apparatus of the grass cover. High NDRE values represent higher levels of chlorophyll content in grass blades: the soil has the lowest values, while unhealthy leaves have intermediate values. It is also indicated to map the variability of nitrogen-based fertilizer requirements for the foliar apparatus, but it is not a good indicator for the nitrogen requirement in the root system. The NDRE index is therefore an indicator of the state of health of the turf, and of how lush, green, uniform and compact in the leaf coverage, better than the NDVI in the summer and autumn season. Furthermore, it is a higher performing index of NDVI during a monitoring set on frequent and intra-seasonal surveys because in many cases the NDVI loses sensitivity (ie information of variability within the plot) with increasing storage of chlorophyll in the leaf apparatus and with increasing leaf coverage area.
Index NDRE (MAIA WV) after correction of the geometric and radial distortion and after radiometric correction, of a plot in an intensive cultivation of turf. The image was acquired at an altitude of 25 m AGL (GSD: 12 mm / pixel) on a day with a clear sky in July 2017.
GNDVI (Green Normalized Difference Vegetation Index – (NIR-Green)/(NIR+Green)) – This index replaces green to red in the NDVI formula to highlight and differentiate the presence of chlorophyll inside the leaves of the turf: it is essential in a monitoring plan that provides for several frequent acquisitions at a set time interval, to identify the moments of activation and inter-season quiescence. Also suitable for estimating nitrogen-based nutrient requirements and for locating water shortages.
Index GNDVI (MAIA WV) after correction of the geometric and radial distortion and after radiometric correction, of a plot in an intensive cultivation of turf. The image was acquired at an altitude of 25 m AGL (GSD: 12 mm / pixel) on a day with a clear sky in July 2017.
EVI (Enhanced Vegetation Index – (2.5*((NIR2-Red)/((NIR2+6*Red-7.5*Coastal)+1))) – In areas characterized by high vegetative density (such as turf), the reflectance information obtainable in the high frequencies of the Blue or the Purple are strategic in the measurement of these vegetational indices, to penetrate the surface of the leaves and evaluate the presence of water and for map the variability in terms of nutrient inputs, before and after the scheduled treatments. Tendentially, the EVI index shows values from 0.2 to 0.8 for photosynthetically active vegetation, thus classifying it from the worst to the best state of health.
Index EVI (MAIA WV) after correction of the geometric and radial distortion and after radiometric correction, of a plot in an intensive cultivation of turf. The image was acquired at an altitude of 25 m AGL (GSD: 12 mm / pixel) on a day with a clear sky in July 2017.
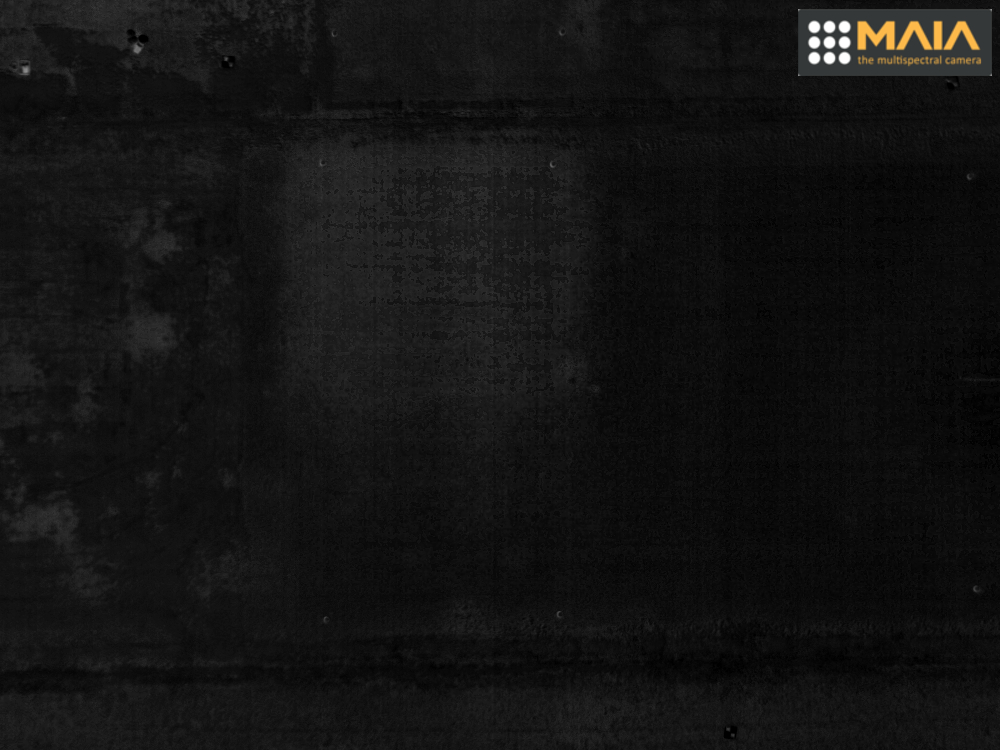
NRGRI (Normalized Red Green Ratio Index – (Red-Green)/(Red+Green)) – The relationship between the reflectance of the turf in the red band and the reflectance in the green band, in certain environmental and phyto-vegetative conditions, is an important test to assess the vegetative health of the grass cover, especially if related to other site measurements- specifications. In this index, the lowest values (which are those that tend more to black, while the higher values tend to white) highlight the areas with greater vigor.
Index NRGRI (MAIA WV) after correction of the geometric and radial distortion and after radiometric correction, of a plot in an intensive cultivation of turf. The image was acquired at an altitude of 25 m AGL (GSD: 12 mm / pixel) on a day with a clear sky in July 2017.
NWSI (Normalized Water Stress Index – (Coastal-Red)/(Coastal+Red)) – The reflectance information at the high frequencies of the Violet range is normalized on the Red, which in the healthy vegetation has a high absorption. High values of this index, ie those more tending to white, are found in areas with high water content within the leaf apparatus and in the soil, while low values denote a lack of water and aging or dry vegetation.
NWSI index (MAIA WV) after correction of the geometric and radial distortion and after radiometric correction, of a plot in an intensive cultivation of turf. The image was acquired at an altitude of 25 m AGL (GSD: 12 mm / pixel) on a day with a clear sky in July 2017.
Several other multispectral vegetational indexes were calculated, like PRI, SAVI, CCCI, BWDRVI, ecc.
Scientific studies show that methods of diagnostic evaluation of the turf that use other tools are confirmed by the data obtained from the survey carried out with MAIA multispectral camera: for example, the CWSI index (Crop Water Stress Index), which is an evaluation tool for monitoring the water stress and to plan the irrigation rate, which is obtained from the plant temperature minus the air temperature, divided by the atmospheric vapor pressure deficit (AVPD) (Alderfasi, Nielsen. 2001), is positively correlated with the NWSI index above. Or the CGI (Crop Growth Index), which is a measure of the increase in size and mass of the crop over a period of time, the calculation of which depends on the values of NAR (Net Assimilation Rate) and LAI (Leaf Area Index), it is very useful if it is related to other indices such as GNDVI if we want to estimate the growth of vegetation cover over a given period of time.
Research and development in the field of multispectral data acquisition systems, both in the platform and in the field of sensors, which, with regard to image analysis, are working to give the agronomic discipline more and more cognitive tools of biological, physical phenomena and chemicals that occur within individual plants. Certain calculations are applied to the reflectance data of the individual bands, indices are calculated on the image or on the multispectral orthophoto, or the digital number values relating to specific bands are distributed in the three RGB channels to diversify the turf areas.
These data are the geo-referenced cartographic basis for all site-specific agronomic and meteorological measurements that define the culture monitoring framework. The analysis subsequent to the acquisition and processing can lead to the diagnosis and localization of the symptomatic signs of turf criticality. Some are listed here:
Soil compaction – It consists of a crushing of the soil particles between them, with a consequent decrease of the empty spaces of the microporosity and of the macroporosity, responsible respectively for the movements of water and air in the ground. The phenomenon mainly concerns finer-textured soils (clay or silty), especially if trampled under wet conditions and only in the first 5-7 cm. Increasing the compaction therefore decreases the aeration of the soil that is depleted of oxygen, saturating itself with carbon dioxide and other toxic gases for the roots. Water movements become more difficult, the infiltration and percolation of water along the profile decreases, and therefore any water stagnation can be highlighted and localized by a differentiation in the vegetation cover of the turf.
Water stress – A phenomenon of water scarcity can be detected and localized in the leaf apparatus or in the ground, or on the contrary an excessive intake of water or nutrients, and identify areas where there is water stagnation due to the composition of the soil or its excessive compaction; it is possible to map the texture of the soil and to distinguish the most clayey or loamy soils from the sandy ones, perhaps comparing the multispectral survey with a survey carried out with an electromagnetometer, and consequently deciding where and how to spread the lawn rolls, and how to plan the irrigation and drainage system.
Thermal stress and humidity – The species used for most lawns for ornamental and sports use are Festuca arundinacea, Poa pratensis, lolium perenne and Festuca rubra rubra. These essences are microthermal, ie they live in optimal conditions in warm continental and temperate Mediterranean climates. This means that with temperatures above 26 degrees maximum and above the minimum of 20 they suffer from heat but above all from humidity. The humid heat favors the development of most of the pathogenic parasitic fungi of the turf: at the same temperature, the increase in humidity (the relative humidity is the moisture content in relation to the temperature) determines a “heating” of the turf which in turn triggers a series of retroactive processes that slow down the metabolic processes of the herb, increasing the state of stress. When the water vapor content increases (ie increases atmospheric humidity) the difference with the water vapor contained within the leaf is reduced: consequently the plant transpires less. By decreasing the recirculation of water between the plant that absorbs it from the soil and the external atmosphere, the leaf tends to heat up more, the whole plant increases in temperature, also accumulating a strong thermal stress. In essence, even though it may seem paradoxical, in order to continue photosynthetic processes correctly, the lawn must lose water in the right quantities to cool down and keep cool. In climatic conditions where high humidity is associated with a high level of humidity, maintenance operations must ensure that the lawn is well ventilated and drained, as well as being well watered in the cold hours. In climatic zones of dry heat, it will instead be very important to constantly bathe. The scientific literature of studies on vegetation confirms that evapotranspiration and photosynthetic activity are easily monitored phenomena with multispectral relief.
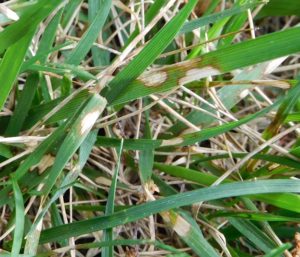
Grass fungus disease
Fungal attacks – The symptoms of a toxic contamination of the turf, however depending on the season, the humidity, the geographical area, the temperature and the surface content of water, are often represented by more or less regular and variable spots in size and in color. The multispectral survey conducted with MAIA can locate and perimeter the areas presenting fungal attacks: thanks to the high geometric and radiometric resolution of the sensors (1280×960 pixels and sensor pixel size of 3.75 μm x 3.75 μm), the symptoms of a intoxication, which are represented by widespread and generalized yellowing of the lawn, linked to the presence of many irregular spots on the leaf lamina, such as to give a general and indistinct aspect of the turf.
Cyanobacteria and algae – They can cause various problems to grass surfaces: they alter the appearance, block the possibility of light reaching the grass and can make the surface slippery. The Nostoc, for example, are cyanobacteria that create dark green or blackish gelatinous growths, which often appear in conditions of high humidity over the entire surface of the lawn, making it slippery. Lichens are brown or gray growths that grow horizontally in the turf always in autumn / winter, when we can also find white, yellow or orange molds that produce small gray fruiting bodies that then release masses of violet spores – Bruno. Cyanobacteria, lichens and liverworts are found on meadows where drainage is scarce and shadow conditions cause a wet surface. The compacted soil is particularly prone to developing algae, particularly around the drip line of trees or shrubs.
The analysis of the results obtained can be done on GIS softwares, where geo-referenced informations can be managed, and where there are several tools to graphically show and map those areas with different condition on the turf, so as to provide the agronomists a precise diagnostic tool on which to base the crop monitoring plan. It is also possible to integrate the multispectral images and the reflectance data of each single pixel obtained from the multispectral survey in the cultivation management software that the agronomist uses for maintenance.
Thanks to the multispectral survey, information can be obtained for:
Rationalize fertilizing by localizing symptoms of nutritional deficiencies
Choose frequencies and right moments for mowing and monitor the consequences
Choose the best performing species based on acquired environmental and multispectral data
Rationalize pesticide applications by identifying biotic stress in advance
Rationalize the supply of fertilizers through localized and site-specific interventions
Rationalize water supply by identifying areas with real water scarcity
Prevent fungal attacks on the turf by promptly intervening
Avoid excessive compaction by monitoring the consequences in real time
Enrich the land with sustainable long-term fertilization plans
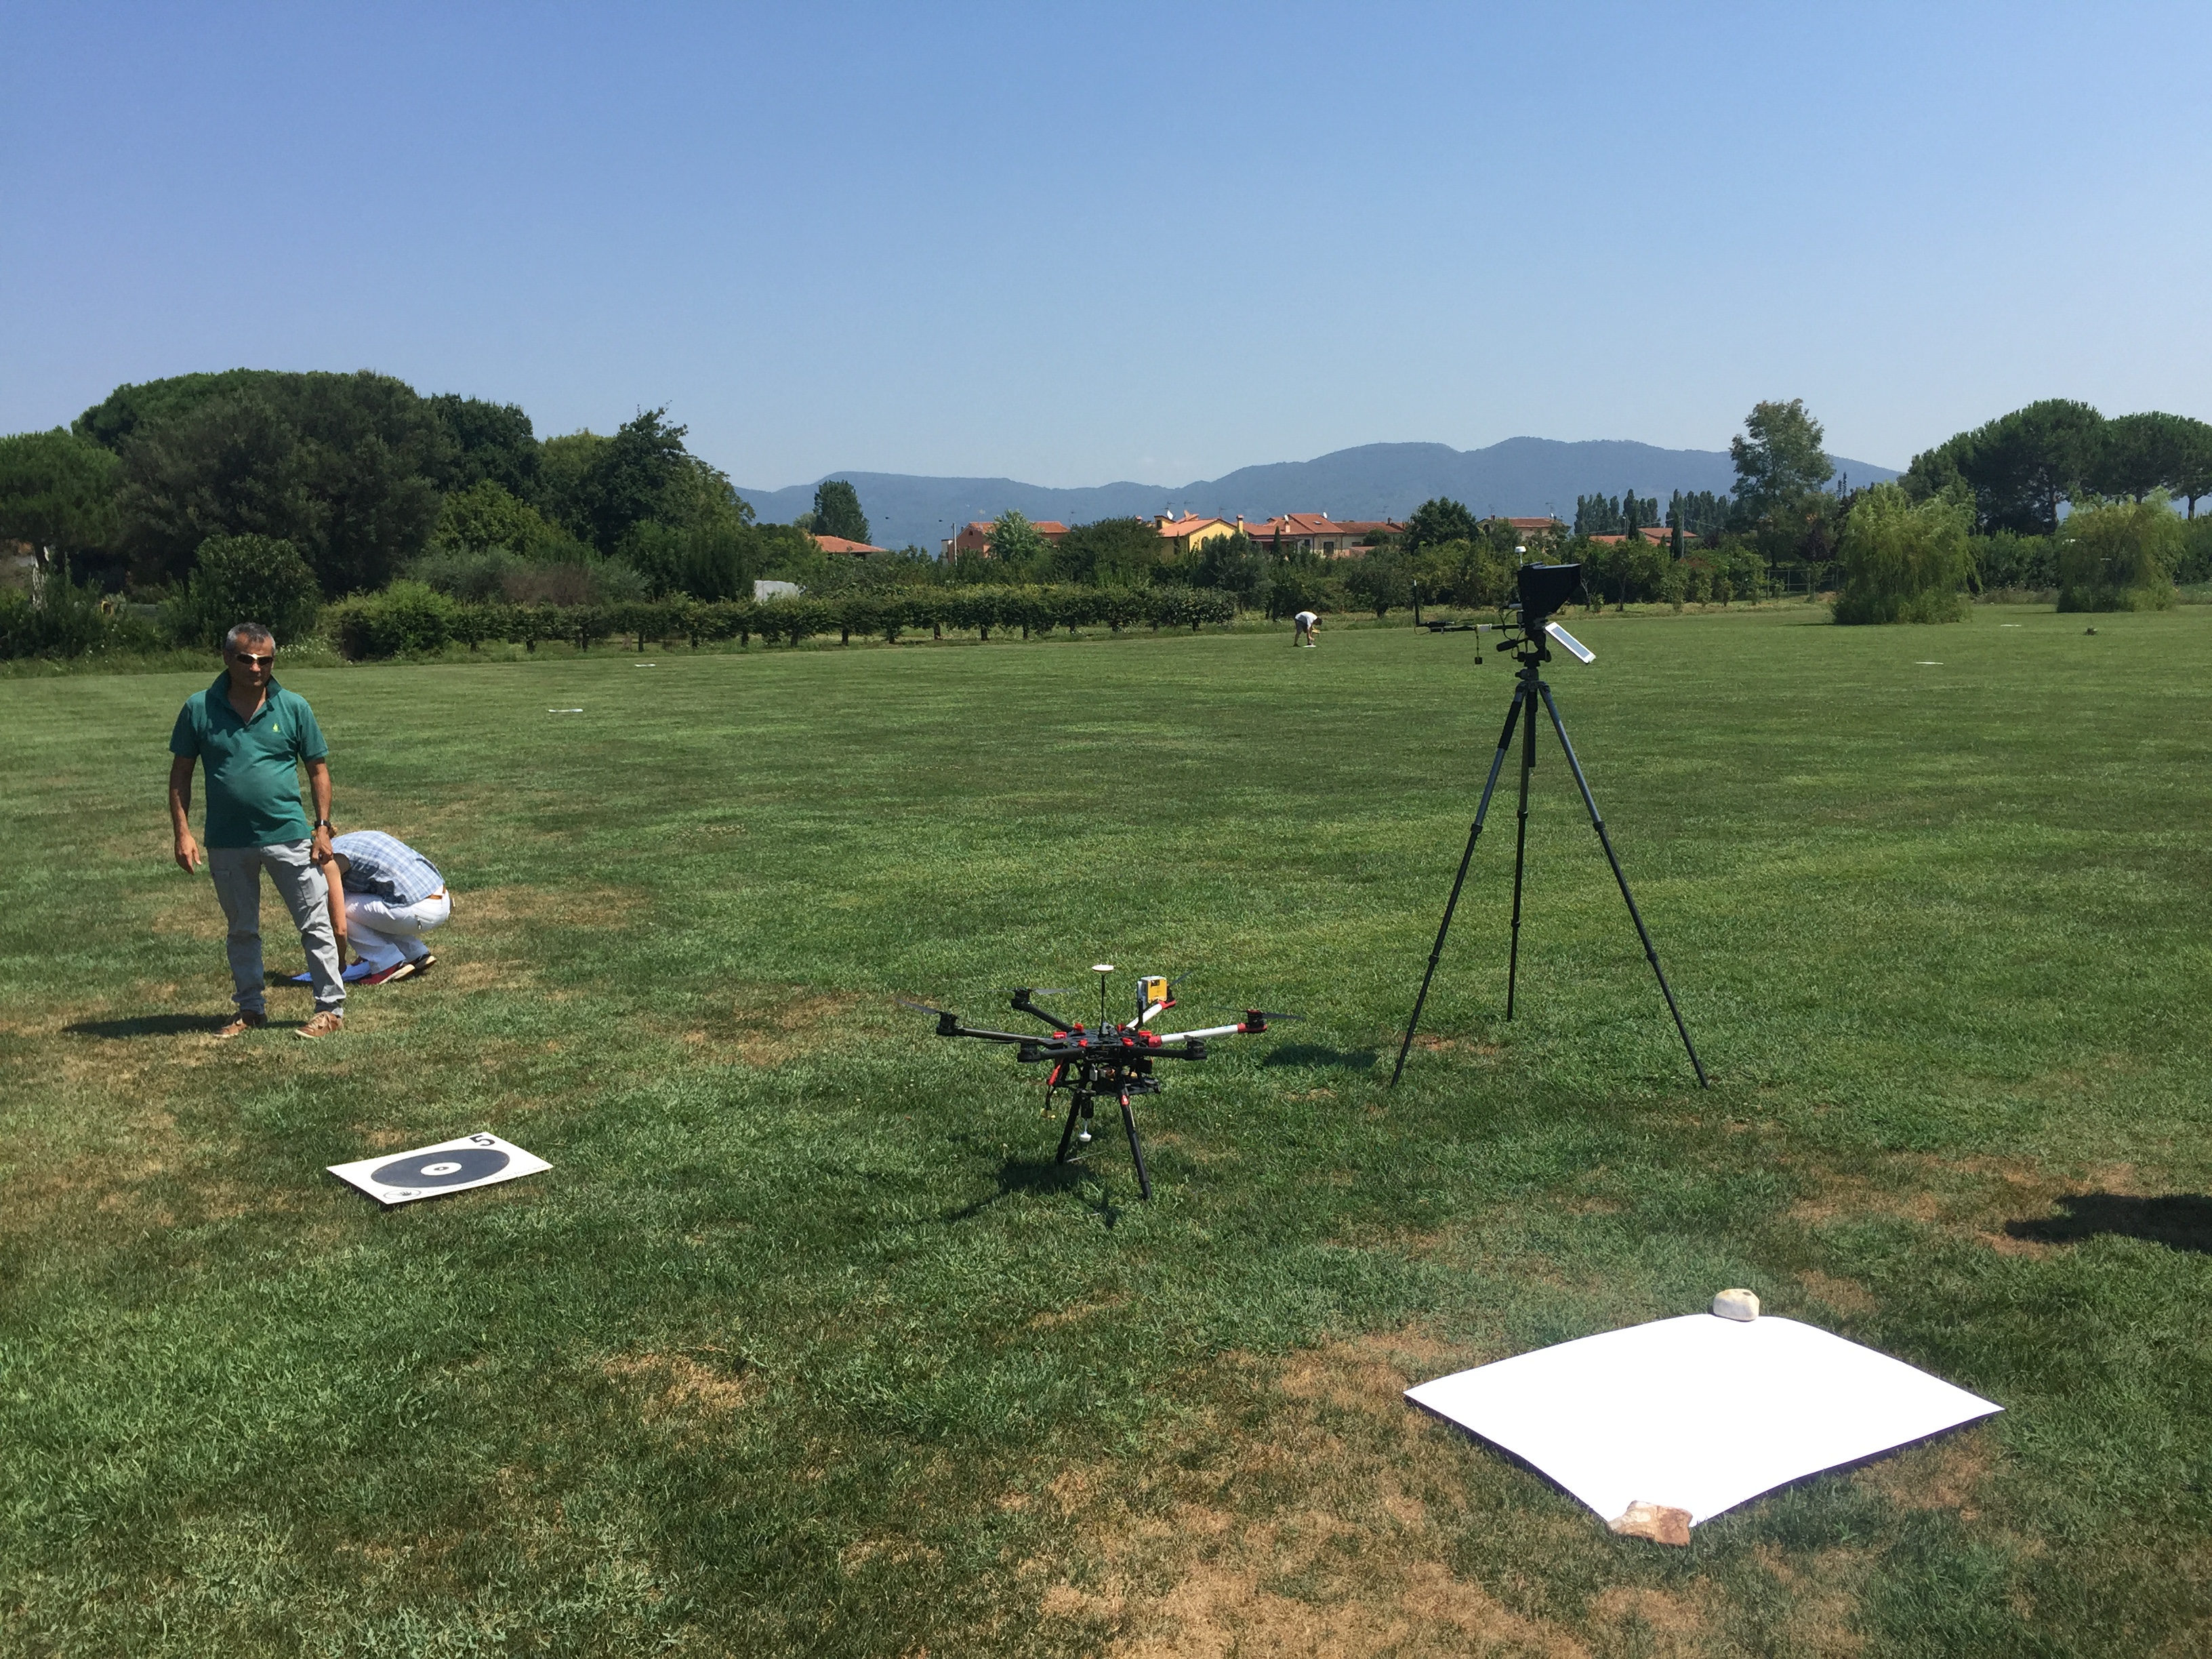
SAL Engineering drone and ground control station ready to fly over a cultivated ornamental turf field.
The analysis of vegetative criticalities on turf for sporting or ornamental use has the purpose of highlighting the factors limiting the correct metabolism of the planted species and therefore the vegetative activity of the vegetation cover. The aim is to optimize growth, promote the development of the root system and make the crop uniform, in a crop management that could be more and more sustainable.
MAIA Multispectral Camera is a project of the highest technological value entirely Made in Italy. It is the right tool to carry out the preventive diagnostic phase at specific times of the year, where certain phyto-vegetative conditions are expected, to have orthorectified and geo-referenced images, and cartographic analysis products obtainable from them.
The early identification of the critical issues has in fact a positive effect on the qualitative yield, on the ability to withstand stresses and on management costs: a seasonal monitoring plan of the turf can no longer ignore such a multispectral proximity survey.
MAIA S2 and Sentinel-2: remote to proximal sensing
Comparing multispectral data for environmental monitoring and precision agriculture
Following the development of MAIA WV, the most technologically advanced multispectral camera ever proposed in the market of sensors for surveying by plane or UAV, SAL Engineering has developed MAIA S2, in collaboration with the most important universities and research institutes in Europe, involved in studies of earth observation and remote sensing. MAIA WV has the same wavelenght intervals of WorldView-2 satellite mission by DigitalGlobe: this choice was made following evaluations regarding the most widespread applications of satellite remote sensing that could be useful also in the field of proximal sensing with airplanes or UAVs. In fact, WorldView-2 provides commercially available imagery of 0.46 m resolution, and eight-band multispectral imagery with 1.84 m resolution.
RGB false composition of a multispectral orthophoto obtained with MAIA S2 installed onboard an aircraft
Great interest in the use of satellite images for applications in agriculture and environmental monitoring was given by the Copernicus Programme of the European Space Agency, thanks to the Sentinel missions. The request of large agronomic companies and research institutes involved in sustainable agriculture projects was to have multispectral images at the same wavelength ranges available in the Sentinel missions data hubs, with the same radiometric reliability, but with a much higher geometric resolution and with the possibility to decide the moment of the multispectral survey according to the needs of the agronomic research.
Hence, MAIA S2 is designed to ensure multi-layer and multi-channel images at the same wavelength intervals as the multispectral sensor on board the Sentinel-2 satellite, with complete control on reflectance data and radiometric correction of RAW images, with the advantage of having a ground sample distance lower than 5 cm flying at 100 m AGL.
Sentinel-2 is an Earth observation mission from the Copernicus Programme that systematically acquires optical imagery at high spatial resolution (10m to 60m) over land and coastal waters. The mission is a constellation with two twin satellites (Sentinel-2A and Sentinel-2B). The mission supports a broad range of services and applications such as agricultural monitoring, emergencies management, land cover classification, water quality, disaster control, humanitarian relief operations, risk mapping and security concerns.
The Sentinel-2 mission has the following key characteristics:
Multi-spectral data with 13 bands in the visible, near infrared, and short wave infrared part of the spectrum
Systematic global coverage of land surfaces from 56° S to 84° N, coastal waters, and all of the Mediterranean Sea
Revisiting every 5 days under the same viewing angles. At high latitudes, Sentinel-2 swath overlap and some regions will be observed twice or more every 5 days, but with different viewing angles.
Spatial resolution of 10 m, 20 m and 60 m
290 km field of view
Free and open data policy
To achieve frequent revisits and high mission availability, two identical Sentinel-2 satellites (Sentinel-2A and Sentinel-2B) operate together. The planned orbit is Sun synchronous at 786 km (488 mi) altitude, 14.3 revolutions per day, with a 10:30 a.m. descending node. This local time was selected as a compromise between minimizing cloud cover and ensuring suitable Sun illumination. It is close to the Landsat local time and matches SPOT‘s, allowing the combination of Sentinel-2 data with historical images to build long-term time series.
The Copernicus Land Monitoring service became operational in 2012. The object of the service is to provide land cover information to users working in the field of environmental and other terrestrial applications. The service is designed to provide geographical information on land cover and related variables such as the vegetation state or the water cycle, and also supports applications in other domains including spatial planning, forest management, water management, agriculture and food security.
The Copernicus Sentinel-2 mission comprises a constellation of two polar-orbiting satellites placed in the same sun-synchronous orbit, phased at 180° to each other. It aims at monitoring variability in land surface conditions, and its wide swath width (290 km) and high revisit time (10 days at the equator with one satellite, and 5 days with 2 satellites under cloud-free conditions which results in 2-3 days at mid-latitudes) will support monitoring of Earth’s surface changes. The coverage limits are from between latitudes 56° south and 84° north. For mission planning and updated coverage status information, see the Revisit and Coverage page.
Sentinel-2 is a European wide-swath, high-resolution, multi-spectral imaging mission. The full mission specification of the twin satellites flying in the same orbit but phased at 180°, is designed to give a high revisit frequency of 5 days at the Equator. Sentinel-2 carries an optical instrument payload that samples 13 spectral bands: four bands at 10 m, six bands at 20 m and three bands at 60 m spatial resolution.
With its frequent and systematic coverage, Sentinel-2 will make a significant contribution to land monitoring services by providing input data for both land cover and land cover change mapping, and support the assessment of biogeophysical parameters such as Leaf Area Index (LAI), Leaf Chlorophyll Content (LCC) and Leaf Cover (LC).
The high revisit frequency of the Sentinel-2 mission will support the attempts to mitigate deforestation by providing greater opportunities to acquire cloud-free image data. This will be of particular benefit in the tropical latitudes, where heavy cloud cover has previously delayed the potential acquisition of a complete catalogue of data. As well as the same parameters that are used in other GMES/Copernicus programmes (such as FAPAR, LAI, LC, LCC and NDVI) that contribute to the monitoring and modelling of climate-induced changes, high-resolution data from Sentinel-2 can support the change detection of flood events for affected countries. The Sentinel-2 satellites will each carry a single multi-spectral instrument (MSI) with 13 spectral channels in the visible/near infrared (VNIR) and short wave infrared spectral range (SWIR).
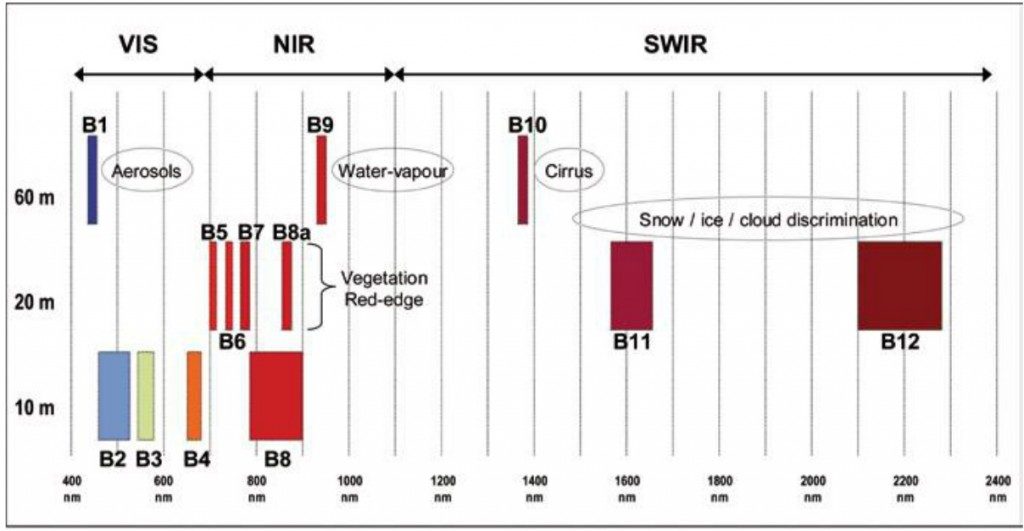
Spectral bands for the Sentinel-2 sensors
Sentinel-2 bands
Sentinel-2A
Sentinel-2B
Central wavelength (nm)
Bandwidth (nm)
Central wavelength (nm)
Bandwidth (nm)
Spatial resolution (m)
Band 1 – Coastal aerosol
442.7
21
442.2
21
60
Band 2 – Blue
492.4
66
492.1
66
10
Band 3 – Green
559.8
36
559.0
36
10
Band 4 – Red
664.6
31
664.9
31
10
Band 5 – Vegetation red edge
704.1
15
703.8
16
20
Band 6 – Vegetation red edge
740.5
15
739.1
15
20
Band 7 – Vegetation red edge
782.8
20
779.7
20
20
Band 8 – NIR
832.8
106
832.9
106
10
Band 8A – Narrow NIR
864.7
21
864.0
22
20
Band 9 – Water vapour
945.1
20
943.2
21
60
Band 10 – SWIR – Cirrus
1373.5
31
1376.9
30
60
Band 11 – SWIR
1613.7
91
1610.4
94
20
Band 12 – SWIR
2202.4
175
2185.7
185
20
Due to the layout of the focal plane, spectral bands within the MSI instrument observe the surface at different times and vary between band pairs. The mission will provide information for agricultural and forestry practices and for helping manage food security. Satellite images will be used to determine various plant indices such as leaf area chlorophyll and water content indexes. This is particularly important for effective yield prediction and applications related to Earth’s vegetation.
As well as monitoring plant growth, Sentinel-2 can be used to map changes in land cover and to monitor the world’s forests. It will also provide information on pollution in lakes and coastal waters. Images of floods, volcanic eruptions and landslides contribute to disaster mapping and help humanitarian relief efforts. Examples for applications include:
Monitoring land cover change for environmental monitoring
Agricultural applications, such as crop monitoring and management to help food security
Detailed vegetation and forest monitoring and parameter generation (e.g. leaf area index, chlorophyll concentration, carbon mass estimations)
Observation of coastal zones (marine environmental monitoring, coastal zone mapping)
Flood mapping & management (risk analysis, loss assessment, disaster management during floods)
As seen in the diagram before, the spatial resolution of Sentinel-2 is dependent on the particular spectral band:
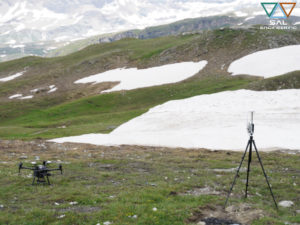
Sentinel-2 spectral bands and geometric resolution.Multispectral survey with GNSS RTK master on field and rover onboard the drone, conducted in a glacier with MAIA multispectral camera
SAL Engineering is composed by operators experienced in acquisition, processing and analysis of remote sensing data from satellite missions, aerial surveys or UAVs, with proven experience over several years.
We provide remote sensing data analysis operations and multi-temporal monitoring by integrating georeferenced data from different acquisition systems and referring to different time intervals, to provide the right digital cartographic products, useful to agronomists and environmental protection operators.
MAIA is the multispectral camera that permits the simultaneous acquisition of high resolution images at various wavelenght intervals in VIS/NIR electromagnetic spectrum regions. It is designed to be employed on board the UAV systems or on board aircrafts, and it finds several applications on board terrestrial rovers too, for precision agriculture, classification of crops, classification of materials on soil, environmental monitoring, dumps monitoring. MAIA S2 is the only multispectral camera equipped with the same wavelenght intervals of the European Spatial Agency’s Sentinel-2™ satellite.
Diagram 2 MAIA S2 amplitude and distribution of wavelenght intervals.
Now, you can compare free satellite data with high-resolution maps obtained through a multispectral survey conducted with MAIA S2, the proper instrument for your multispectral survey.
In recent years, several agronomic research or remote sensing institutes have been evaluating the potential of the data provided by Sentinel missions through direct comparison in the field with high resolution optical sensors, and using UAVs for a closer flight. They evaluate the potential of Sentinel-2 data for retrieving winter wheat LAI, leaf chlorophyll content (LCC) and canopy chlorophyll content (CCC). In coordination with destructive and non-destructive ground measurements, they acquire multispectral data from MAIA, measuring key Sentinel-2 spectral bands (443 to 865 nm). Check for example this paper.
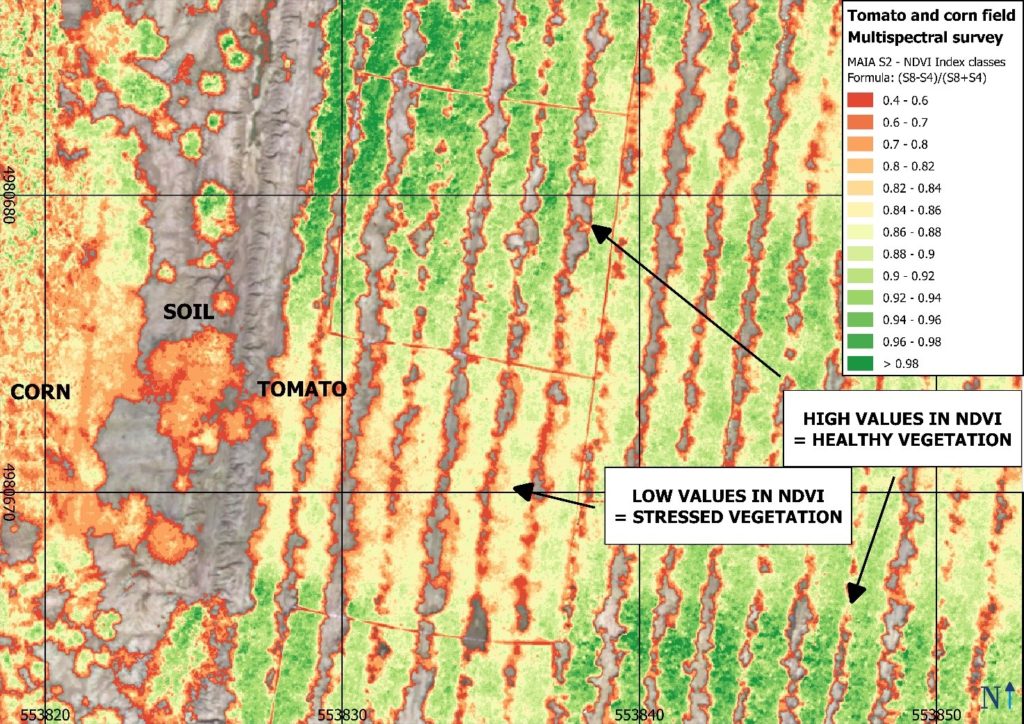
NDVI classified derived from a multispectral survey on a tomato field conducted with MAIA S2.
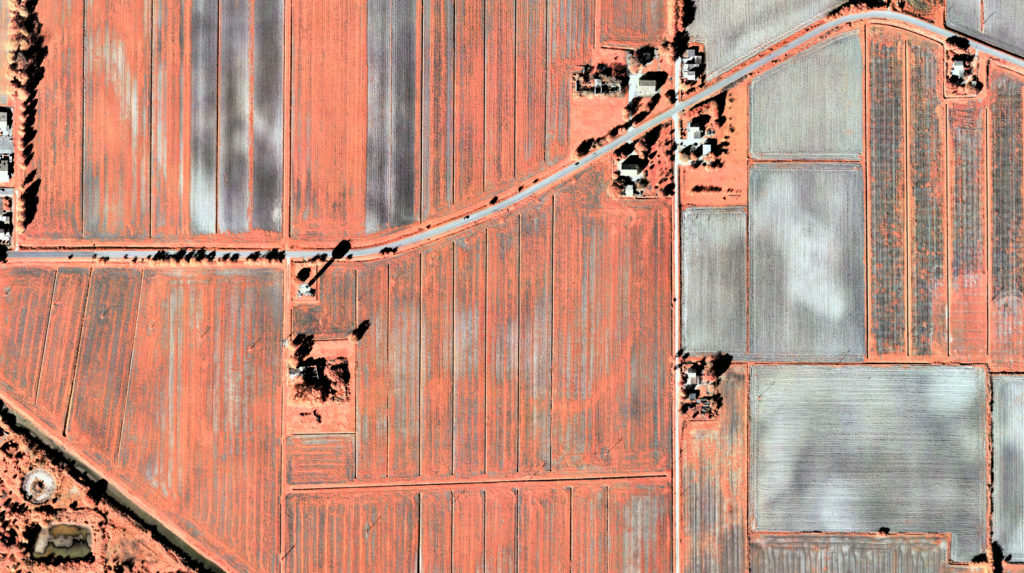
RGB false composition of a multiband orthophoto obtained with MAIA installed onboard an aircraft
If you participate in a research project that correlates multispectral satellite data with agronomic data acquired in the field, if you need a higher geometric resolution for your multispectral orthophotos, if you deal with water quality and want to monitor spills in waters, contact us and we will provide the multispectral survey service according to your needs.
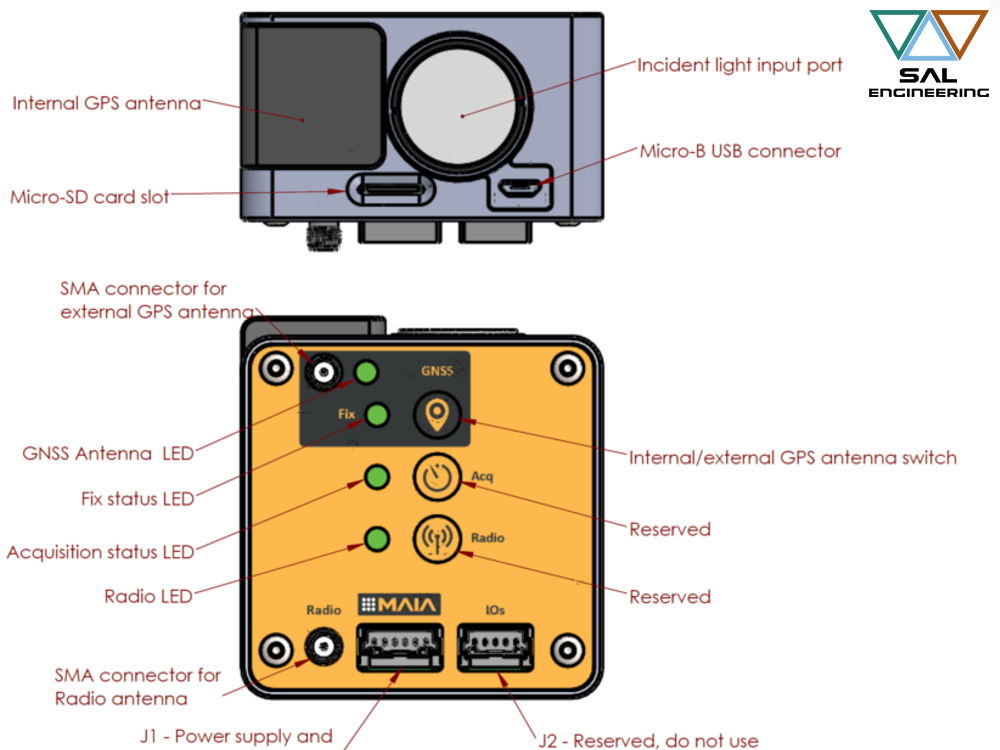
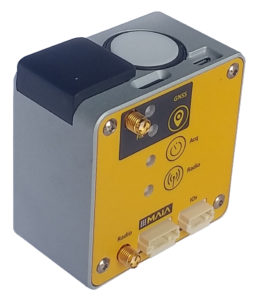
ILS: the Incident Light Sensor designed for environmental monitoring and precision agriculture
ILS – Incident Light Sensor provides irradiance data at the exact time of shooting for each image and in each spectral band, substantially improving the accuracy of radiometric correction and allowing to conduct multi-temporal multispectral surveys.
Thanks to a renewed cutting-edge software technology for measuring incident light during the survey and thanks to the possibility to manage information related to the position of the sun, ILS now provides more accurate and reliable data.
The multispectral data acquisition system composed by MAIA and ILS writes the exposure and reflectance data of the momentary incident light referring to each single shot of the camera, together with positioning data, environmental data and aircraft asset.
The internal GNSS positioning system provides the precise position of the MAIA multispectral images, but most of all the solution with double GNSS receiver, where one ILS serves as a master base and the other acts as a rover onboard RPAS, gives the possibility to process GNSS data in RTK mode (Real-Time Kinematic), ensuring accuracy close to the centimeter for shots positions.
This aspect triples the speed of photogrammetric processing in the main software based on structure from motion algorythms, and allows to obtain accurate data in a very short time. The RTK solution allows to have an accurate positioning of the center of image, which is fundamental when it is necessary to acquire a sample of images in certain points to investigate a physical phenomenon.
Again, this is of fundamental interest in the field of precision agriculture and environmental protection, where it is important to have a mapping of the conditions ex ante and ex post a natural event, a human action, an unexpected episode, a seasonal evolution.
Agronomic companies, universities and research institutes dealing with agronomic research have for years included data from multispectral survey within the method of data processing and modeling of forecast scenarios.
Come and discover on the dedicated page or on Geo-Matching all the technical features of ILS, the Incident Light Sensor designed for science-based multispectral surveys.
Mapping of anthropogenic stress in vegetation and soil
Techniques of acquisition, processing and interpretation of multispectral data related to key environmental processes such as chlorophylline photosynthesis and plant nutrition, have been refined, especially in relation to the identification and mapping of anthropogenic stress caused by soil infiltration or dispersion of polluting material on the surface. Recent research suggests that there is a distinction recognizable by data acquired through multispectral relief, between natural stress due to, for example, drought and an induced or anthropogenic stress due to soil contamination: this difference is visible in a different physiological response of plants (Zinnert and others, 2012).
A series of computations between multispectral bands, known as vegetation indices, have been developed and applied in agronomy and environmental sciences to optimize information from multispectral data, which has an increasing geometric, spectral, radiometric and temporal resolution since new acquisition technologies such as RPAS and new sensors have seen significant technological development over the last decades (Thenkabail, 2000).
For environmental and agronomic applications, the bands most involved in the calculations are Red (630 nm to 690 nm), Red Edge (705 nm to 745 nm), NIR (750 nm to 950 nm), Green (525 nm to 575 nm) and Violet (390 nm to 450 nm). The main vegetation indices are the Normalized Differentiation Vegetation Index (NDVI) and its optimizations or transformations such as the Green Normalized Differentiation Vegetation Index (GNDVI), Soil Adjusted Vegetation Index (SAVI) and also in this case including its optimizations such as the TSAVI (Transformed Soil Adjusted Vegetation Index) or the Modified Soil Adjusted Vegetation Index (MSAVI). A very important index for evaluating water content and quality in vegetation and soil is NDWI (Normalized Difference Water Index). By applying the multispectral survey to environmental monitoring of soil matrix or vegetation matrix, these indices are useful for defining growth rates and the vegetative quality of leafy vegetation.
The study of one of these spectral bands, the Red Edge, allows specifically to classify vegetation contaminated by presence in the soil by inflow or gaseous hydrocarbon suspension.
To apply this method of analysis, it is necessary to first correctly classify the vegetation present on the soil and evaluate the moisture content, the species present, the vegetation cover, the leaf cover index, and the surface temperature in different lighting stages and in different seasons. Vegetation growing in soil contaminated by hydrocarbons has visible damages in the Red Edge band, which is the name given to the sudden change in the spectrum region ranging from 680 nm to 730 nm and is caused by a combined effect of a strong incident radiation absorption and strong inner reflection and scattering of the leaf called “leaf internal scattering”.
The shift in the Red Edge reflection of vegetation, which indicates a reduction in plant health or a stress condition linked to anthropogenic contamination, has long been studied and applied to the agronomic and environmental study of cultivated or vegetated areas.
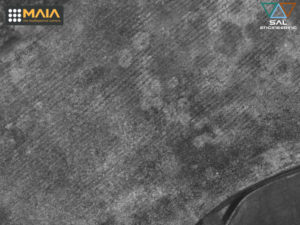
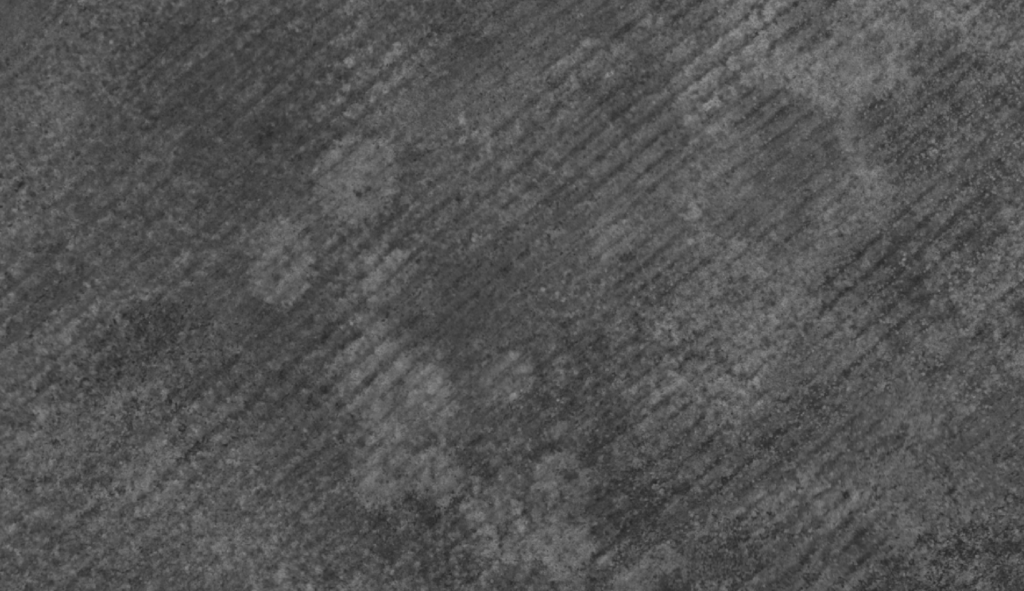
Important tests in this field were carried out by our R&D team on a soil with heavy hydrocarbon contamination: applied remote sensing outputs that were compared in GIS environments were the multi-spectral orthophoto of the 8 bands of MAIA WV, one thermal orthophoto obtained with high resolution thermal camera and an RGB orthophoto always obtained with MAIA’s RGB sensor. With regard to site investigations in collaboration with environmental engineers to which these products serve as mapping basis for macro-assessment of contamination problems, it was possible to identify and map vegetal anomalies related to the presence of hydrocarbons in the soil, also found in a variation in surface temperature, as well as in a different reflection in the NIR band and, as previously mentioned, particularly in the Red Edge band, and in some indexes.
Figure 1: Detail of the Red Edge band image of a terrain with hydrocarbon contamination.Figure 2: Detail of a thermal orthophoto of a terrain that is contaminated by hydrocarbons.Figure 3: Detail of a RGB Orthophoto of a terrain that is contaminated by hydrocarbons.
The field activity is supported by valid scientific publications (Noomen, 2003 & 2008), in which the high-quality method is certified and in which there is evidence of high susceptibility of crops in the presence of gaseous hydrocarbons deposited on the ground or surface stagnation, and more specifically in the presence of Ethane gas (C2H6): cultures exposed to this gas are more spectrally reflected in bandwidths ranging from 570 nm to 700 nm (Noomen 2008).
Thanks to the multispectral survey made with MAIA WV, it is also possible to detect an accentuated concentration of metals in the soil matrix. Wu et al. (2007) demonstrated that spectroscopy in visible and near infrared regions has a strong negative correlation with certain metals (Cadmium, Chrome, Copper, Mercury, Lead, Zinc) in contaminated soils, depending on the presence iron oxide and carbon content. Chloe et al. (2008) and Wu et al. (2008) continued fruitful research on the use of multispectral remote sensing to diagnose the presence of high concentrations of certain metals in contaminated soils.
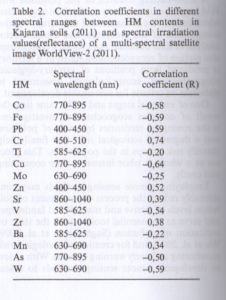
Other scientific studies (Asmaryan et al 2014) confirm the positive correlations between the presence of chromium, lead and zinc measured in the site and detected by multispectral survey, on non-vegetated soil (whose NDVI index by definition goes from 0 to 0.3). The same studies have identified specific reflectance values at certain wavelengths of certain metals in the soil matrix, as shown in the table.
Figure 4: Correlation in different spectral ranges between metal content in non-plant soil and spectral values derived from a WorldView-2 satellite image.
Concerning the multispectral knowledge of the ground matrix, MAIA WV images, related to the wavelength ranges of satellites investigating the spectrum from visible to infrared such as Landsat TM, World-View 2 and Sentinel-2, can be processed to locate and map a large set of minerals, including iron oxides, clays, and other hydroxyl minerals that are often in nature at hydrothermal alterations in the outcrops (Source: Andrea G. Fabbri, Gabor Gaál, Richard B. McCammon, Deployment and Geoenvironmental Models for Resource Exploitation and Environmental Security, Springer Science & Business Media, 2012).

 The University of Modena and Reggio Emilia has also conducted studies, research and insights on the data obtained, also through the thesis of Dr. Lisa Mosconi. The purpose of this thesis is to investigate the potential and problems related to the use of multispectral images acquired by sensors mounted on board of remotely piloted aircraft (APR), also called more commonly drones, for applications of environmental sciences and environmental protection.
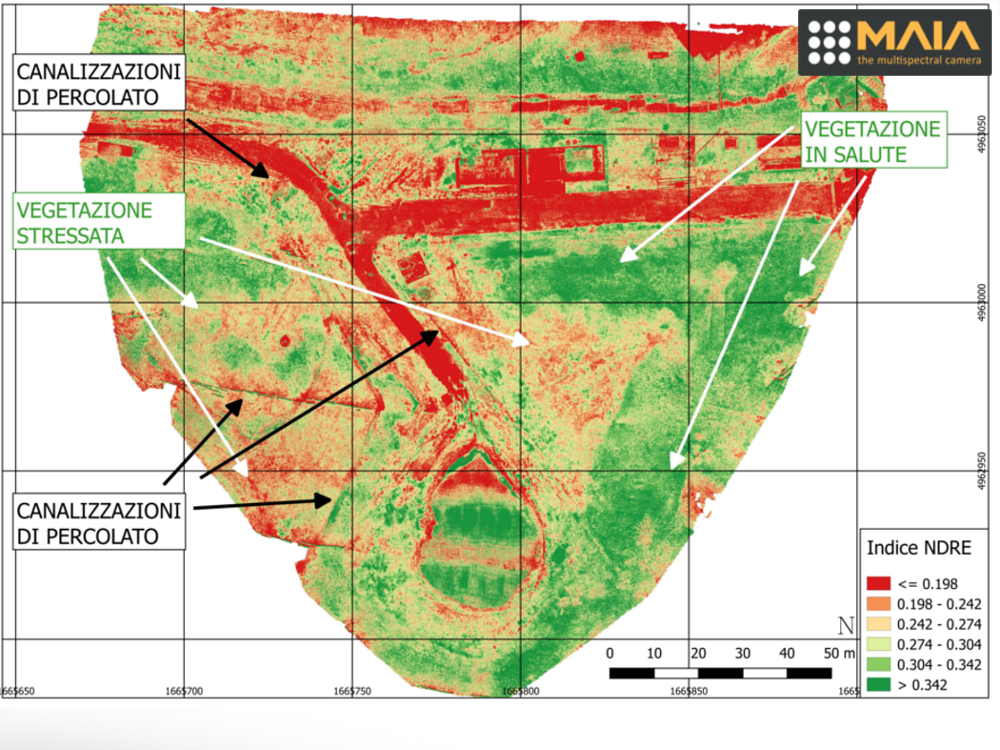 These sensors are sensitive to radiation emitted or reflected on different wavelength intervals of the electromagnetic spectrum, from the visible region (VIS) to that of the near infrared (NIR) and it is precisely this ability to observe beyond the visible, side by side of the ‘high geometric resolution that can be obtained, which makes them particularly interesting for environmental investigations. The acquired data allow to obtain information regarding the stress or vigor of the vegetation, aspects that can also be correlated to other information depending on the territory considered.