“Wheat Lodging Assessment Using Multispectral UAV Data” on ISPRS Archives

maia s2


Wheat Lodging Assessment Using Multispectral UAV Data

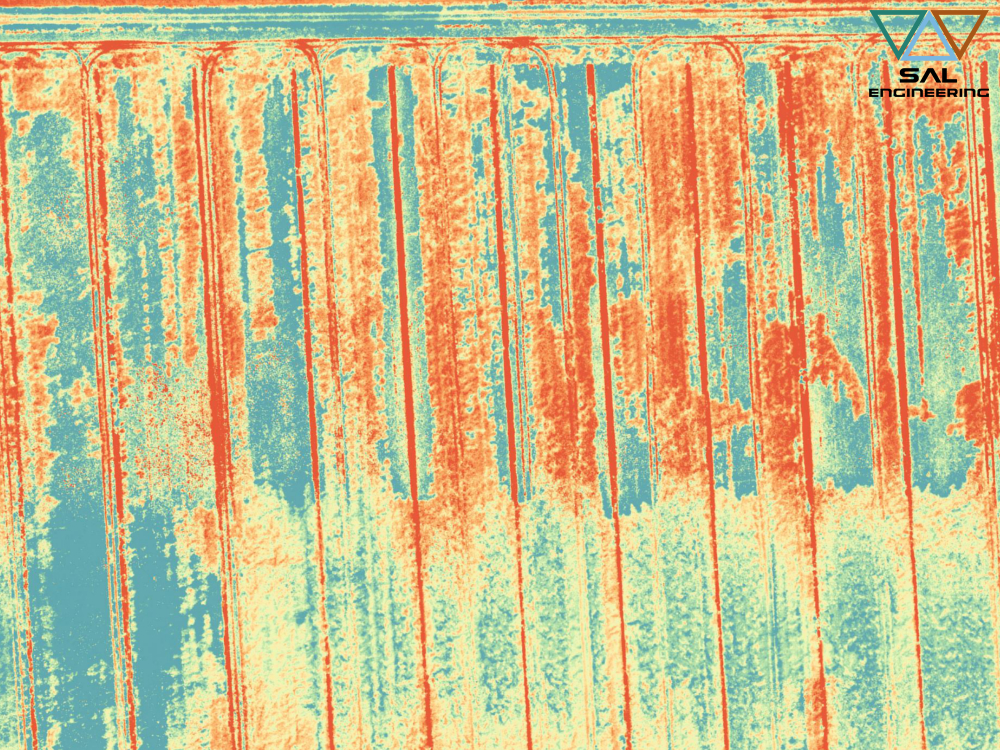
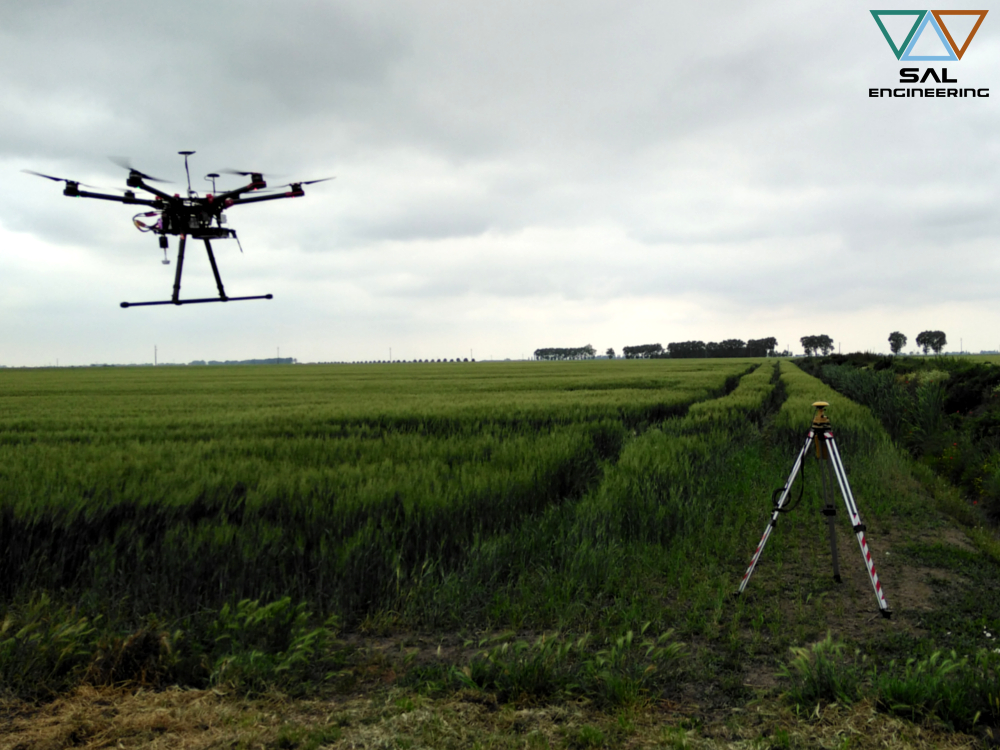
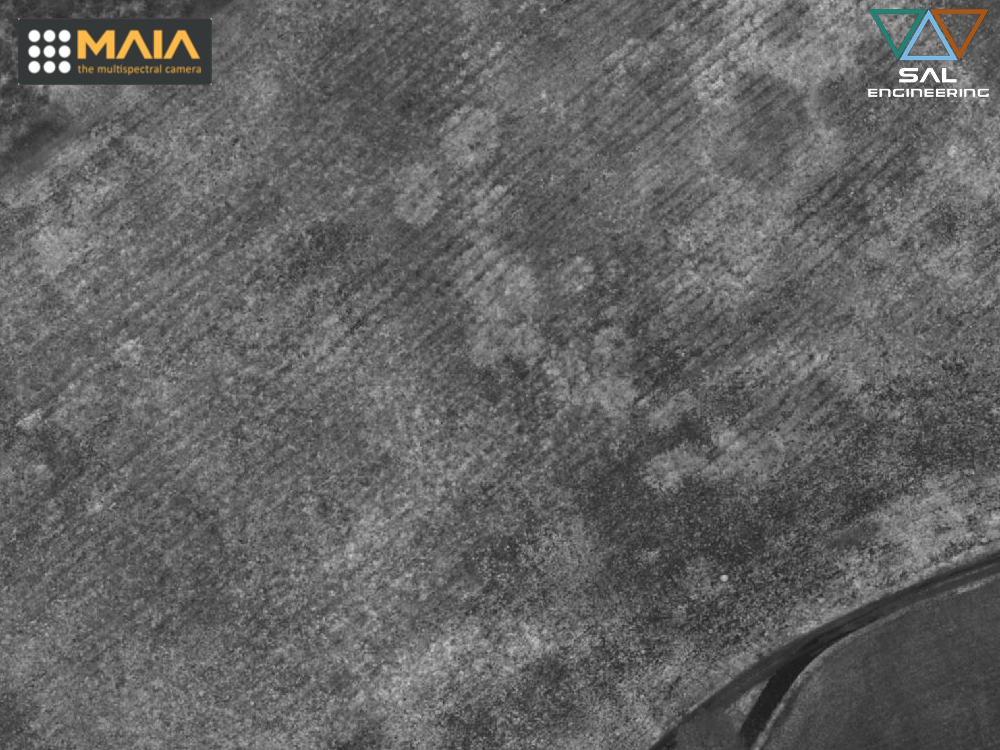
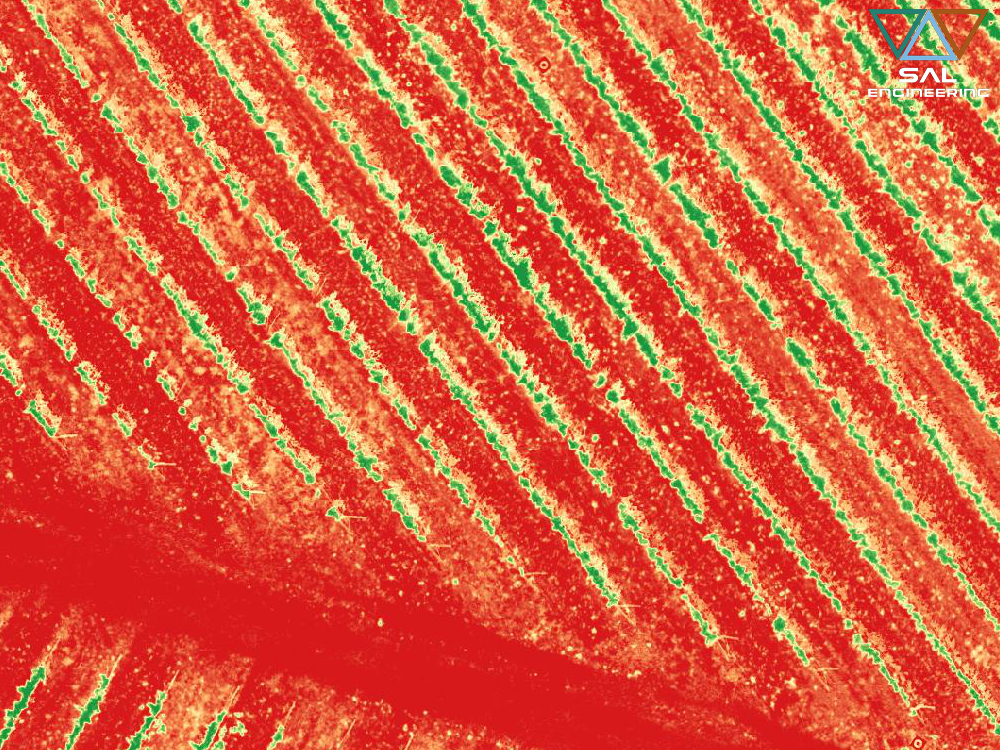
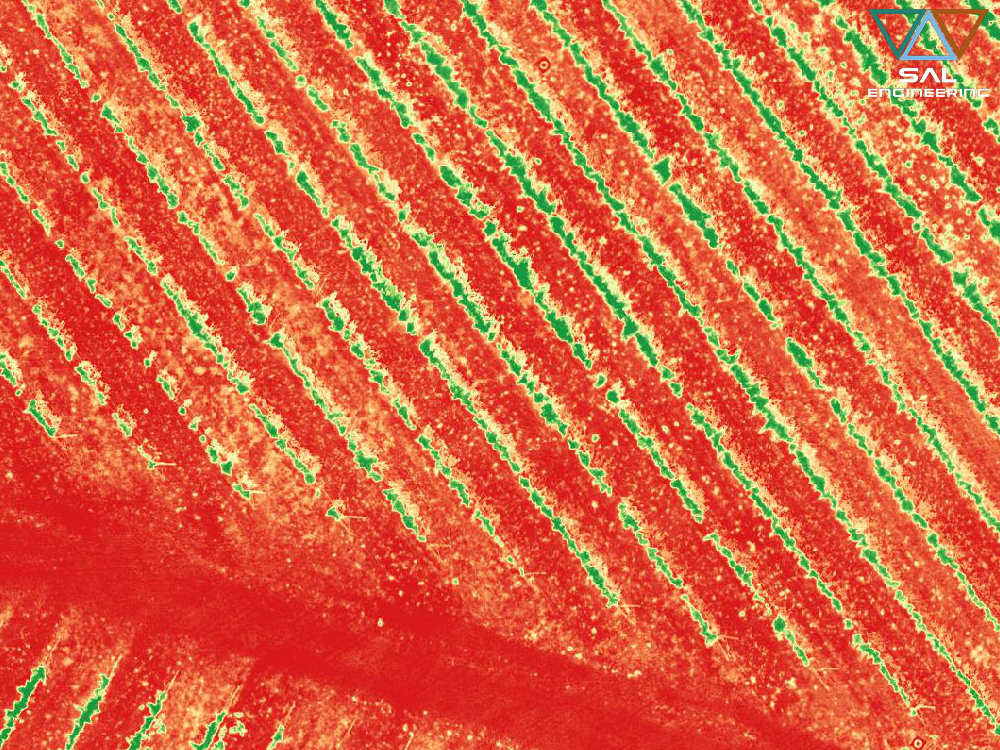
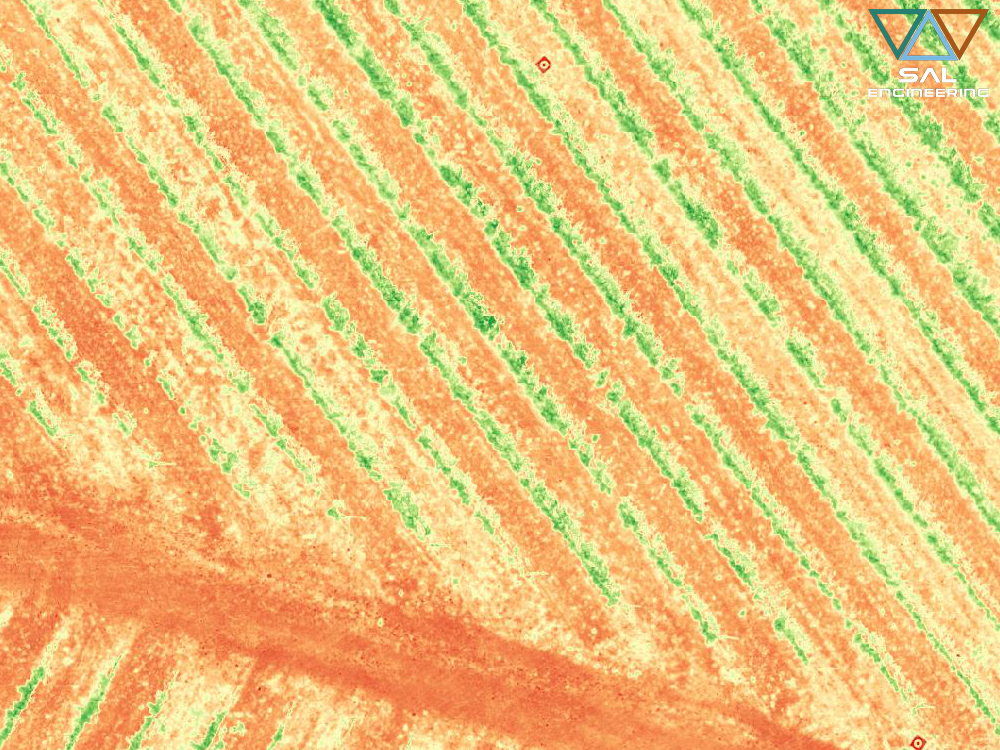
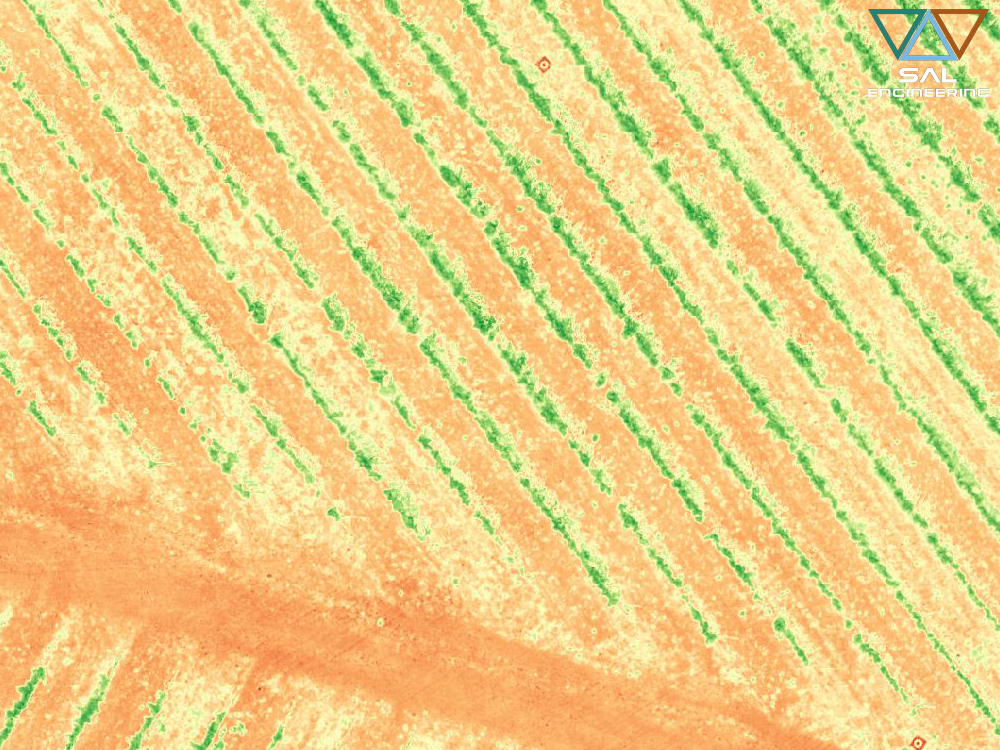
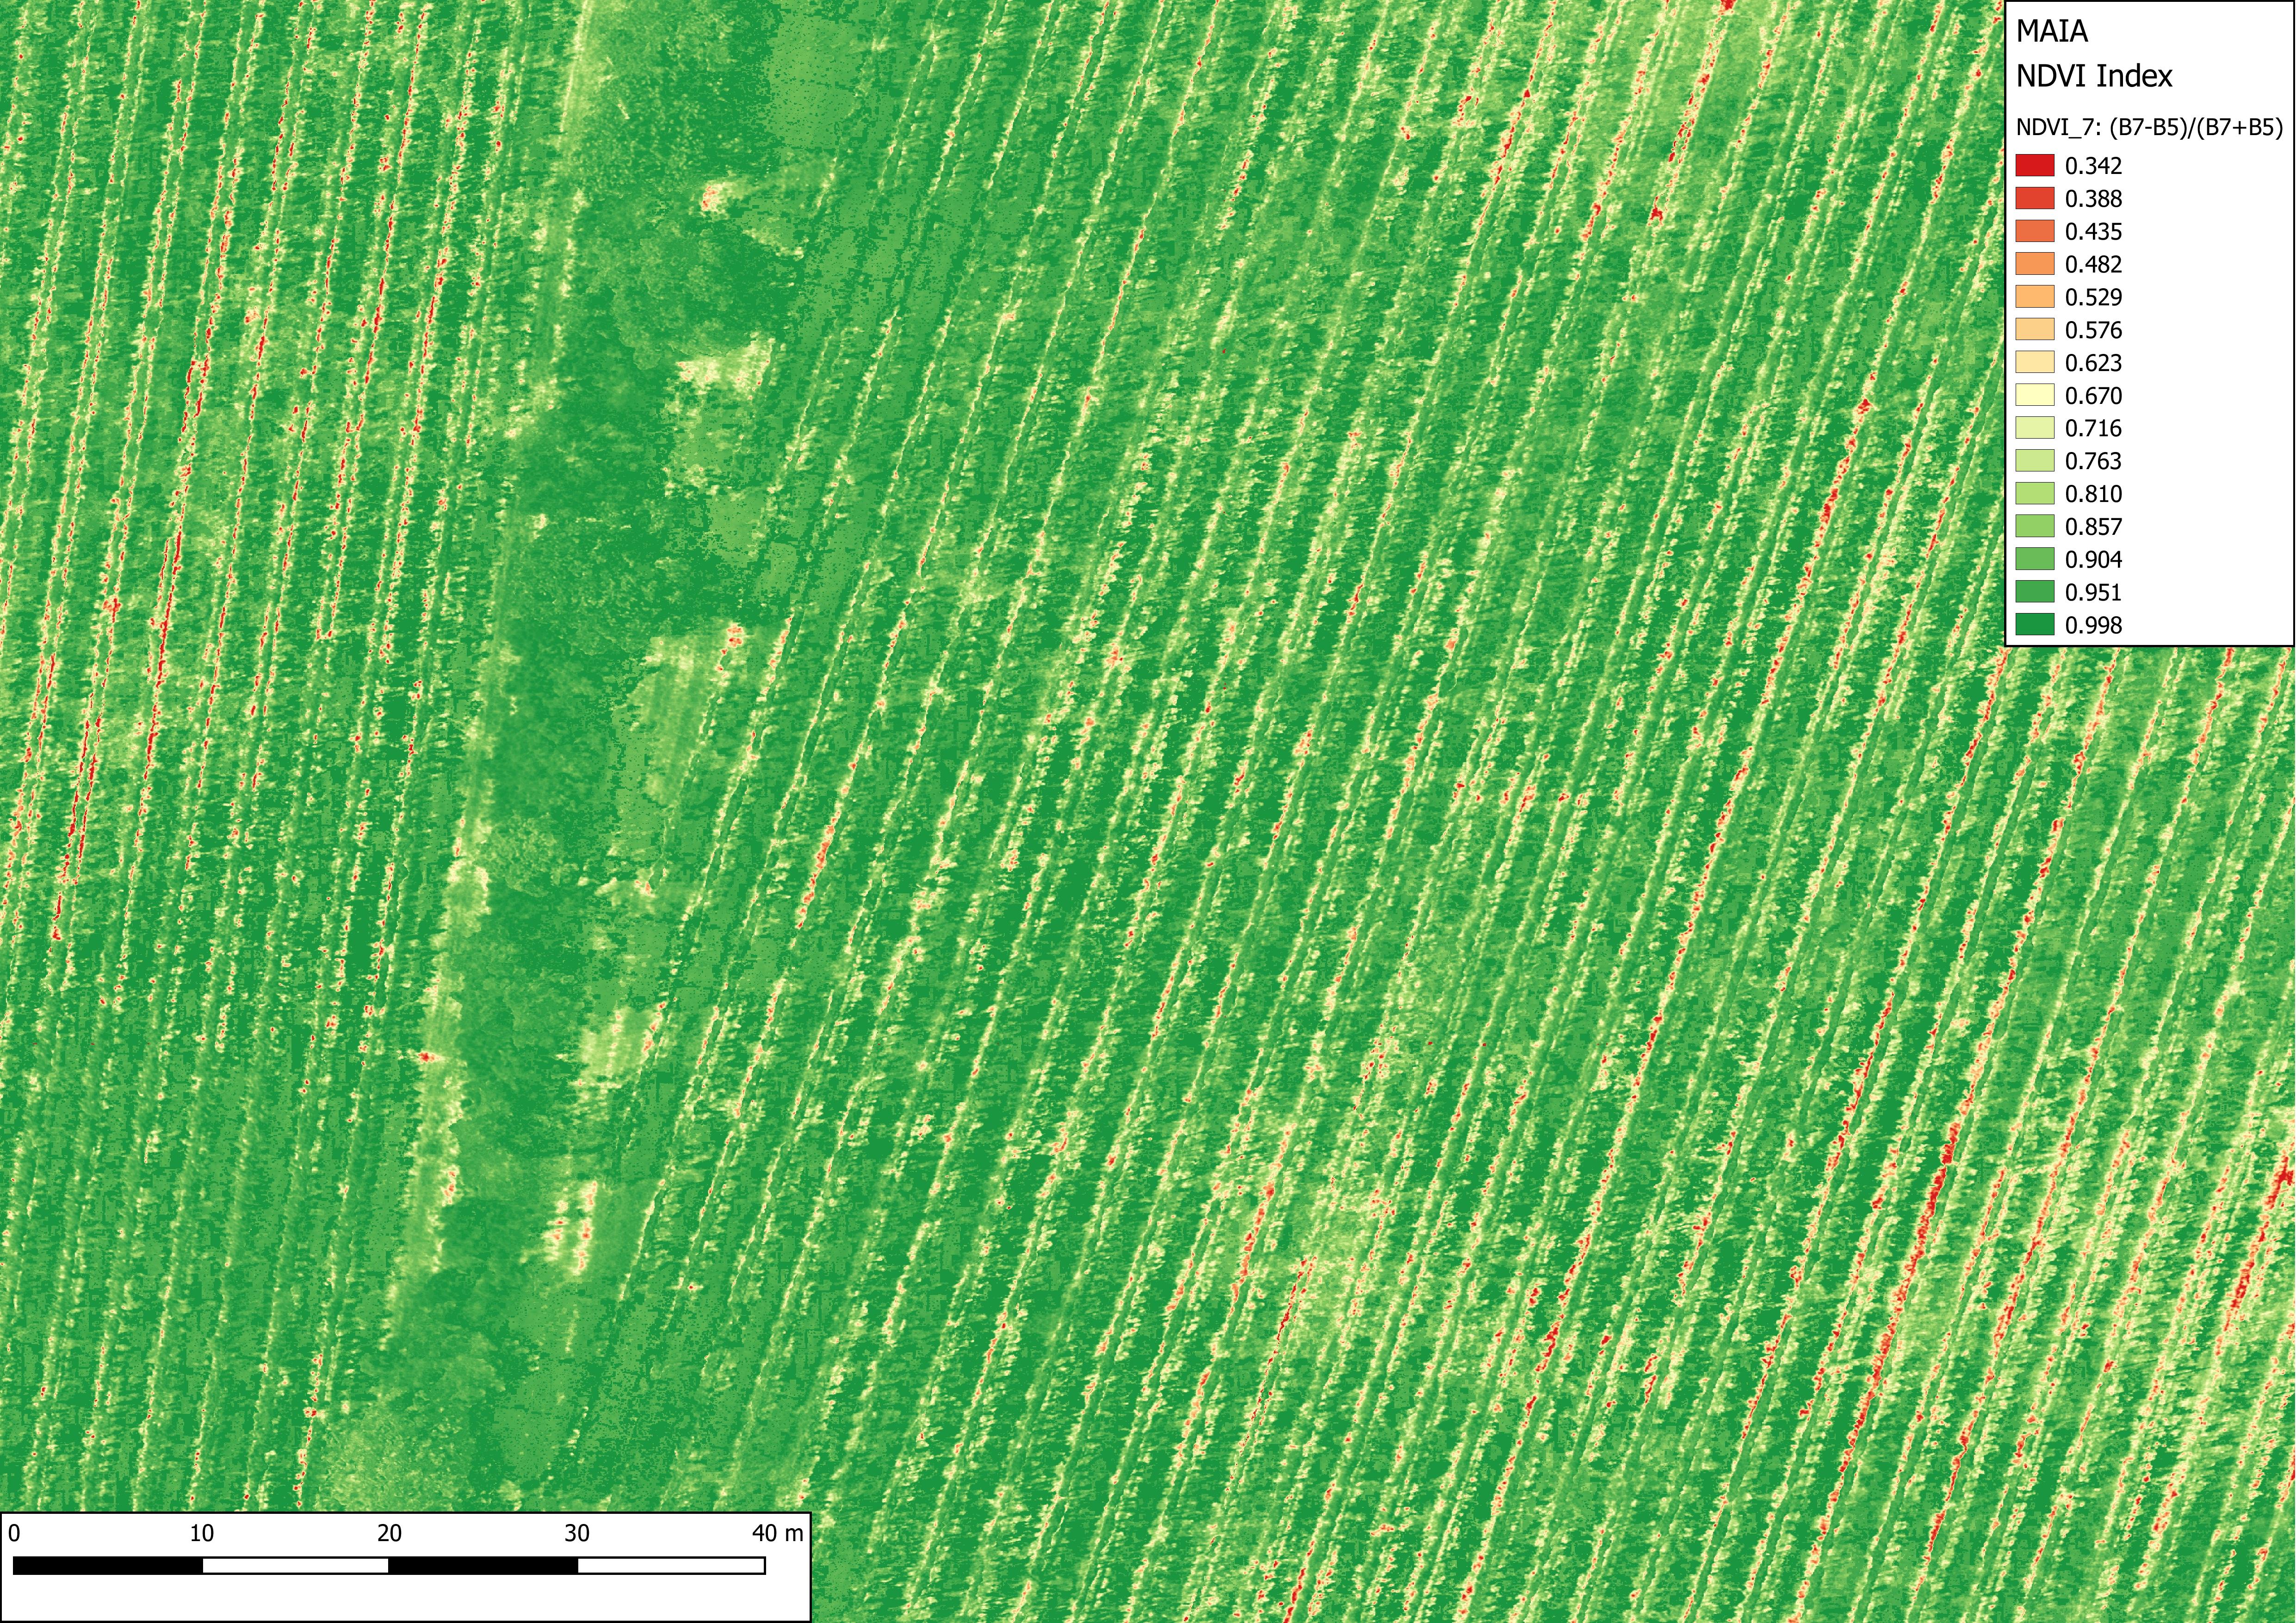
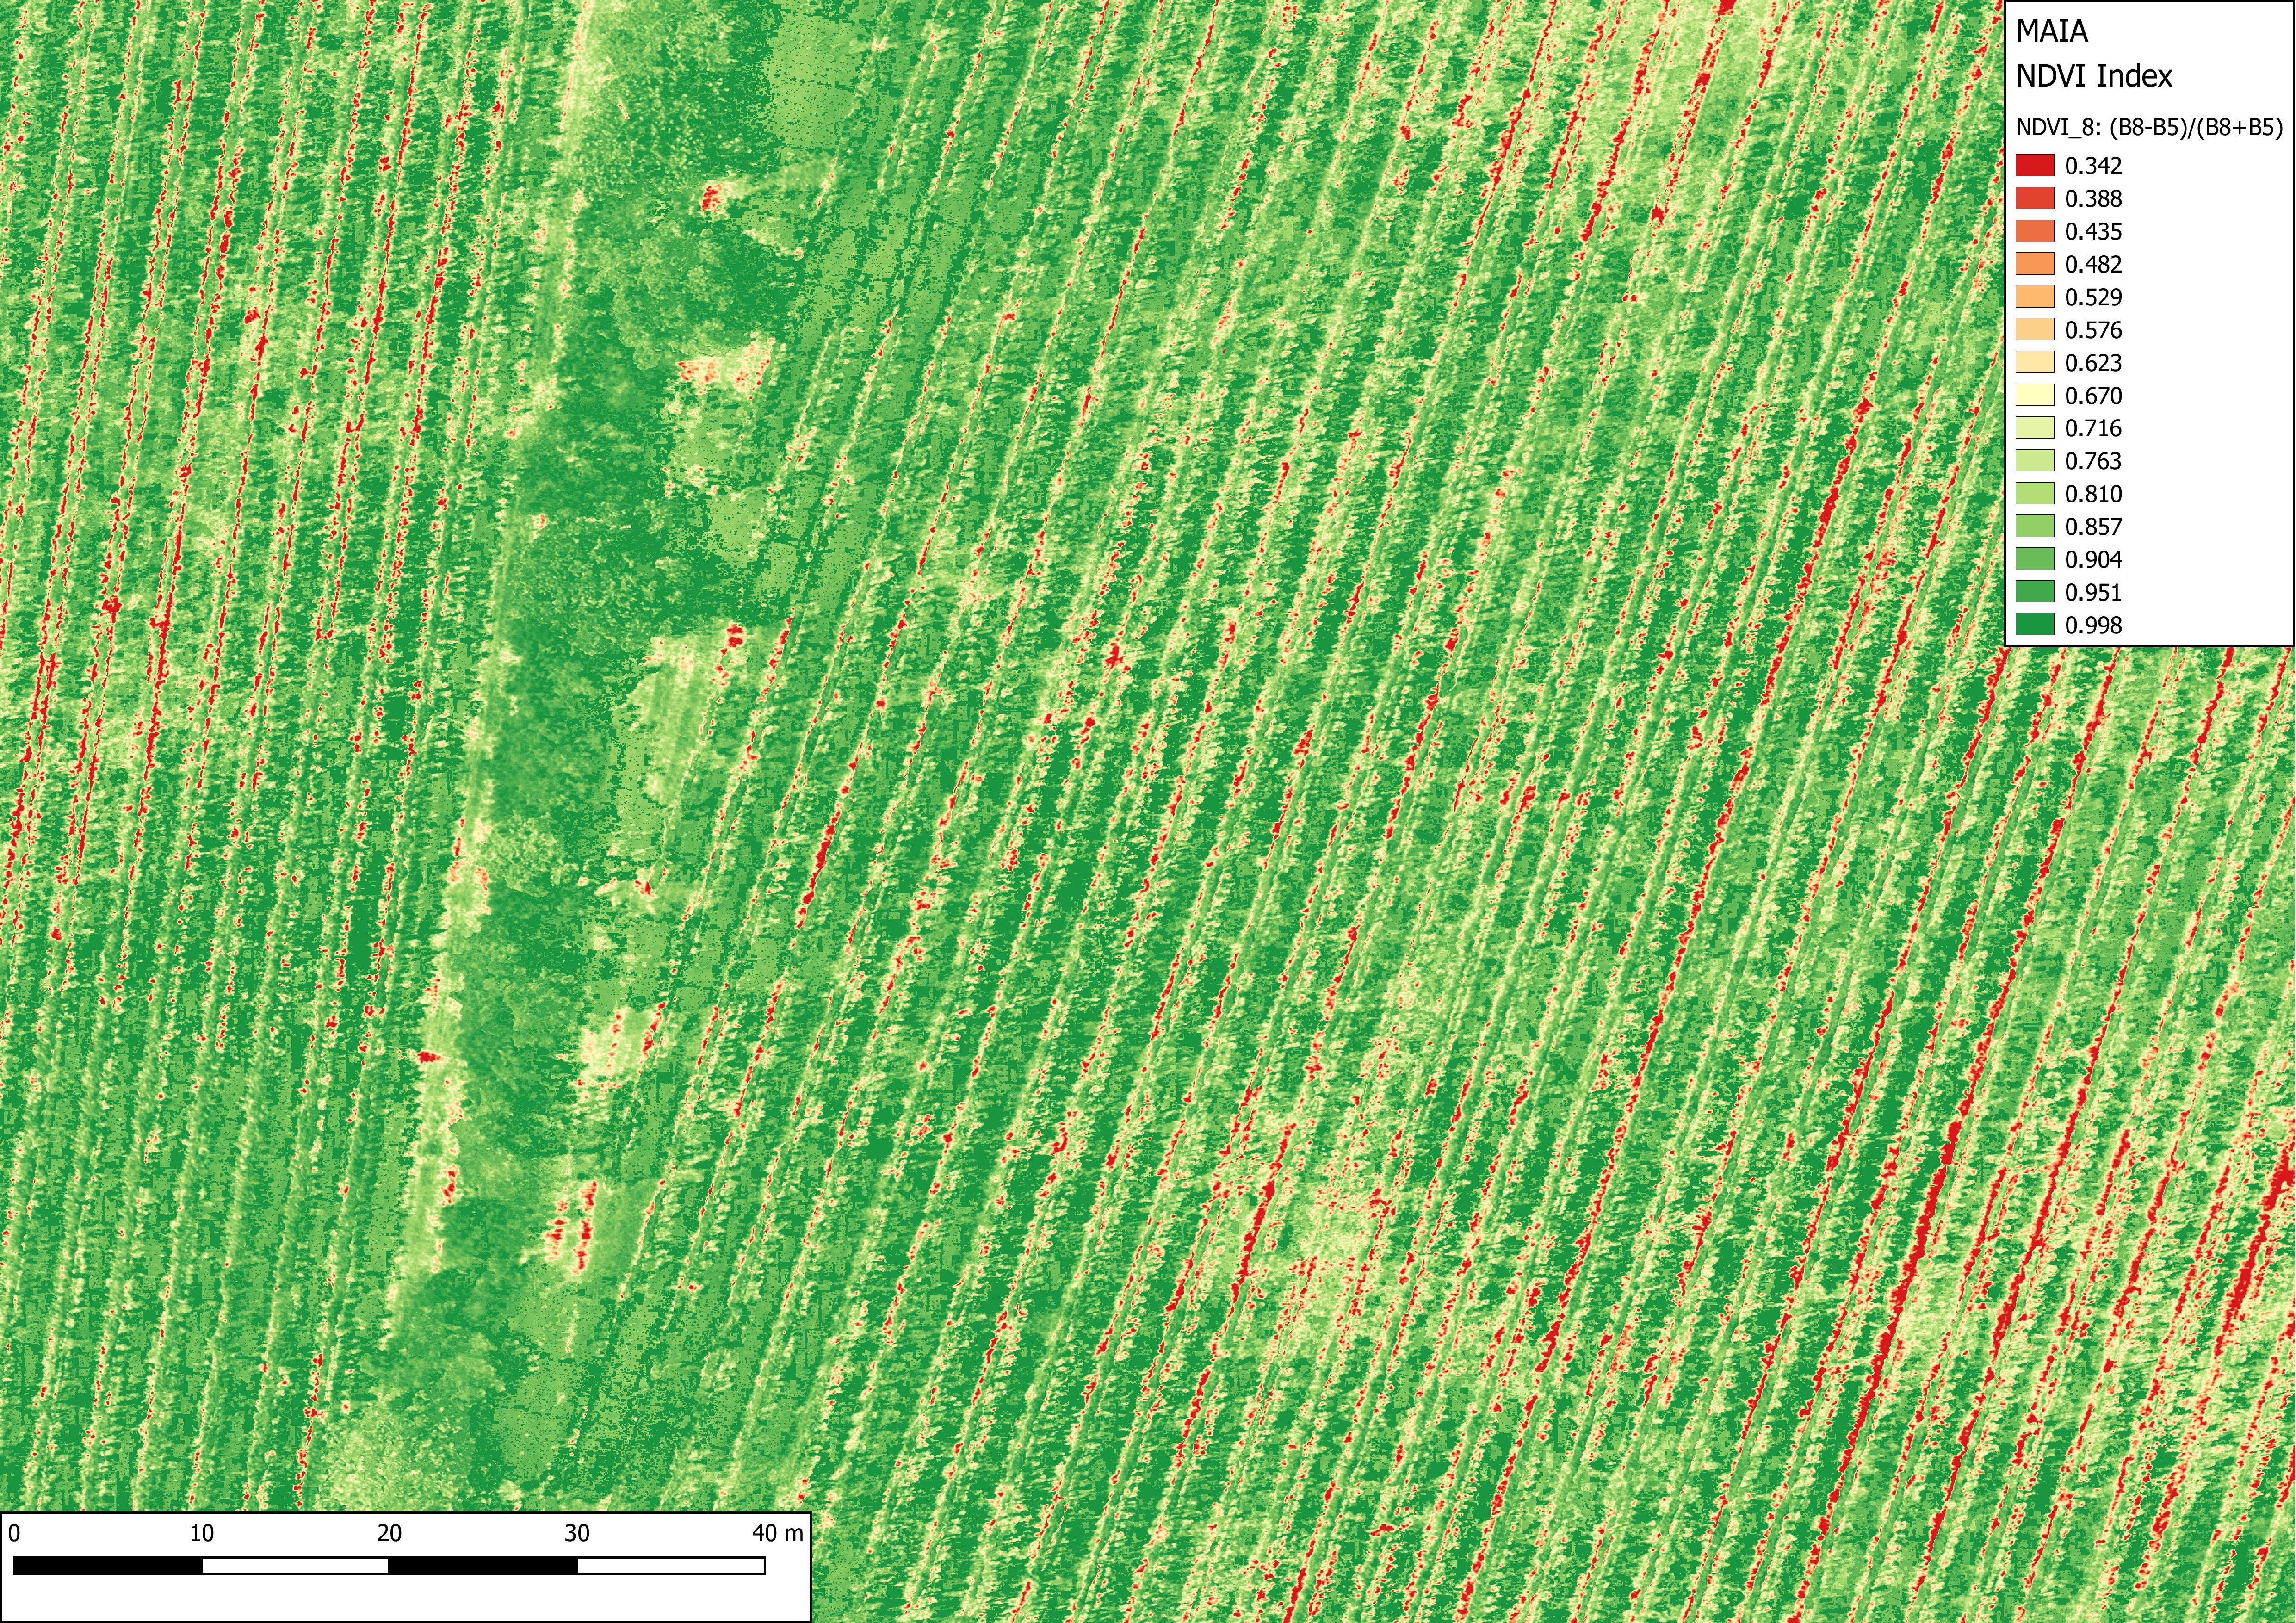
In 2018 we conducted a multispectral campaign using MAIA S2 on wheat fields that had lodging problems. We planned the photogrammetric paths, agreed with agronomists and technicians the geometric resolution and the products that we had to derive from the photogrammetric and multispectral survey, then we set the parameters of MAIA to obtain the correct radiometric information in each band, in such a way as to provide all the data useful for both radiometric and geometric analysis, thus developing a field of study that will have great applications in the future: 3D multispectral data analysis. In our processing lab, we then processed the data and obtained multispectral DSM, multispectral orthophotos and a large dataset of radiometric and geometric sample measurements. Thanks to the study of a team of Italian and Dutch experts, that data acquisition service resulted in a scientific publication.

For the first time, high-resolution multispectral data from a UAV with nine spectral bands (the same as Sentinel-2) covering the 390-950 nm wavelength region has been utilized for lodging assessment. This enabled a comparison of spectral variability across nine bands. Overall, we found that there was an increase in the magnitude of reflectance spectra as the lodging became more severe. The increase was more pronounced in the green, red-edge and NIR regions of the spectrum, thereby showing the sensitivity of these bands to changes in the crop canopy structure. Furthermore, the overall classification accuracy was very high (90%) where NL, ML, and SL classes were separated with reasonable accuracy while there was some mixing of VSL class with the other groups. To conclude, bands in the range of 700- 950nm can effectively detect lodging in wheat. These results underline how multispectral data can be an advancement with respect to conventional RGB camera traditionally mounted on the UAV platforms. Although we believe that these results are transferable to different crop varieties and growing conditions, further research is required to assess this.

Click here below to read and download the article:

Wheat Lodging Assessment Using Multispectral UAV Data 

S. Chauhan 1, R. Darvishzadeh 1, Y.Lu 1, D. Stroppiana 2, M. Boschetti 2, M. Pepe 2, A. Nelson 1
1 Faculty of Geo-information Science and Earth Observation (ITC), University of Twente, Enschede 7500AE, The Netherlands – (s.chauhan, a.nelson, r.darvish)@utwente.nl, y.lu-3@student.utwente.nl
2 CNR-IREA, Institute for Electromagnetic Sensing of the Environment, National Research Council, 20133 Milano, Italy – (stroppiana.d, boschetti.m, pepe.m)@irea.cnr.it

The International Archives of the Photogrammetry, Remote Sensing and Spatial Information Sciences, Volume XLII-2/W13, 2019 ISPRS Geospatial Week 2019, 10–14 June 2019, Enschede, The Netherlands

“Quantifying Uncertainty and Bridging the Scaling Gap in the Retrieval of Leaf Area Index by Coupling Sentinel-2 and UAV Observations” on Remote Sensing journal


Quantifying Uncertainty and Bridging the Scaling Gap in the Retrieval of Leaf Area Index by Coupling Sentinel-2 and UAV Observations

Even within managed crop systems, there is considerable and important within-field variation in LAI at scales finer than the resolution of current satellite imagers.
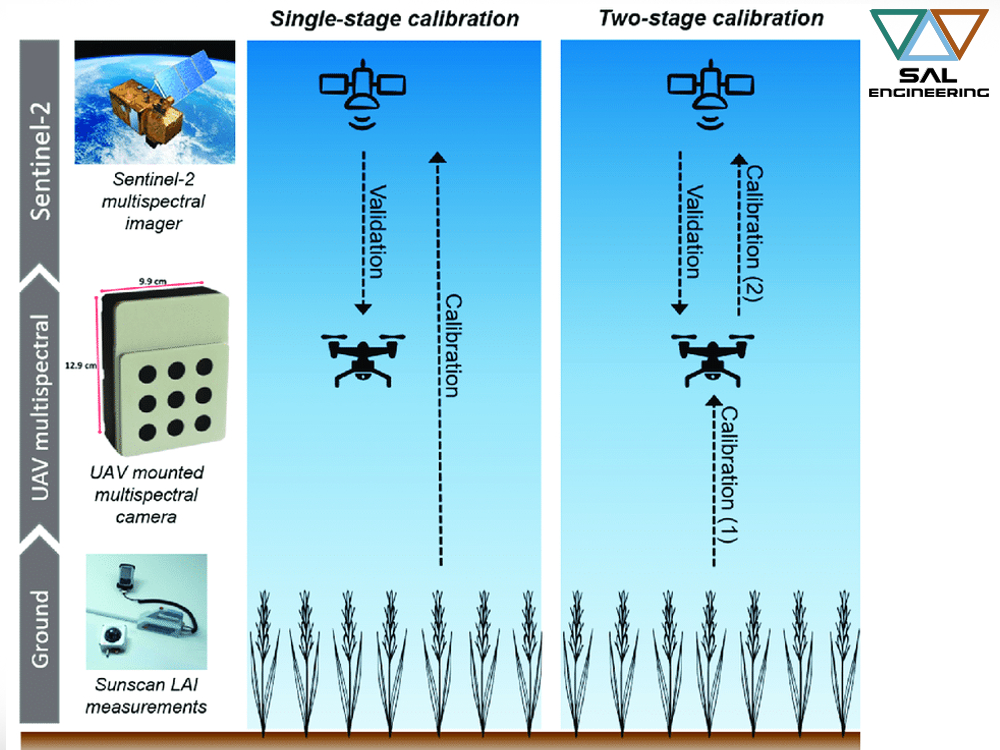
In this scientific research it is demonstrated that UAV multispectral observations at the cm scale, acquired from a sensor designed to match Sentinel-2 spectral bands, improve interpretation of the satellite signal.
Furthermore, the fine-scale resolution of the UAV sensor provides a tool for accurately upscaling LAI ground measurements, which were collected in coordination with the UAV flights, to satellite resolution. The within-field variance in spectral data resolved from the UAV observations was linked to wheat growth stage. Consequently, the Sentinel-2 and UAV platform data were more comparable at the later growth stages, when the vegetation canopy appeared more homogeneous due to a reduced influence of bare soil.
Calibrating models used to retrieve LAI from Sentinel-2 observations directly from ground measurements performed poorly and were unable to explain the variance in LAI throughout the growing season. On the other hand, our novel two-stage model calibration, involving the use of upscaled UAV LAI estimates, demonstrated a clear improvement in the accuracy of LAI retrievals from Sentinel-2 data, reducing bias strongly.
This study has highlighted the value of UAV observations for eectively providing a link between point measurements on the ground and 20-m resolution multispectral observations made from the Sentinel-2 satellite.
Click here below to read the article:

MAIA + ILS for environmental monitoring and precision agriculture


ILS: the Incident Light Sensor designed for environmental monitoring and precision agriculture

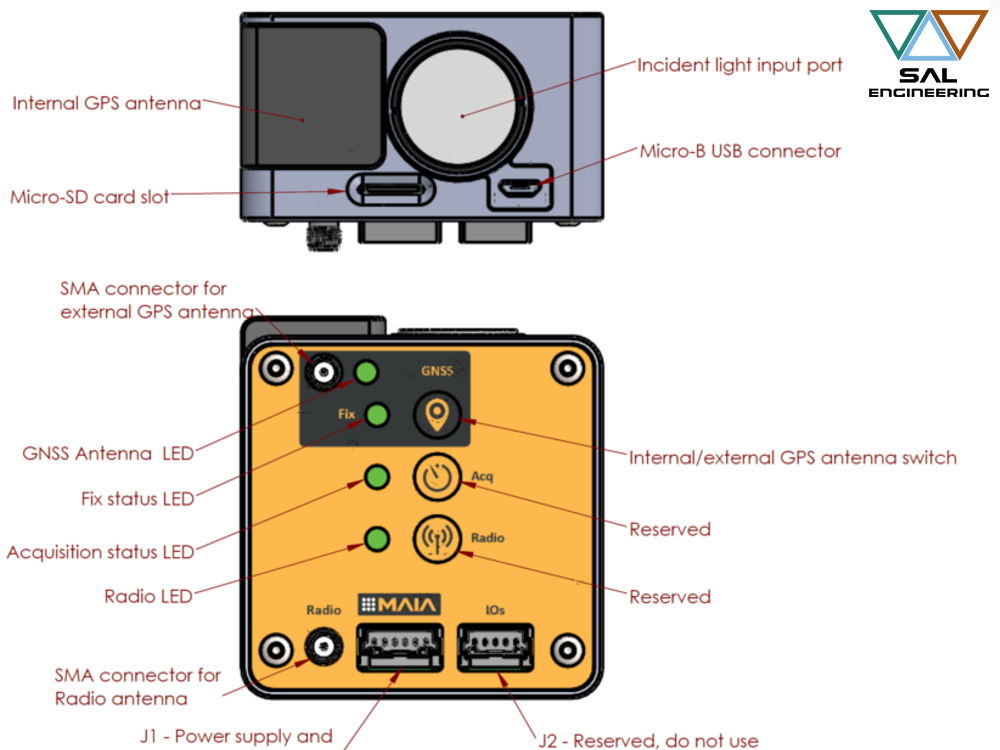
ILS – Incident Light Sensor provides irradiance data at the exact time of shooting for each image and in each spectral band, substantially improving the accuracy of radiometric correction and allowing to conduct multi-temporal multispectral surveys.

Thanks to a renewed cutting-edge software technology for measuring incident light during the survey and thanks to the possibility to manage information related to the position of the sun, ILS now provides more accurate and reliable data.

The multispectral data acquisition system composed by MAIA and ILS writes the exposure and reflectance data of the momentary incident light referring to each single shot of the camera, together with positioning data, environmental data and aircraft asset.


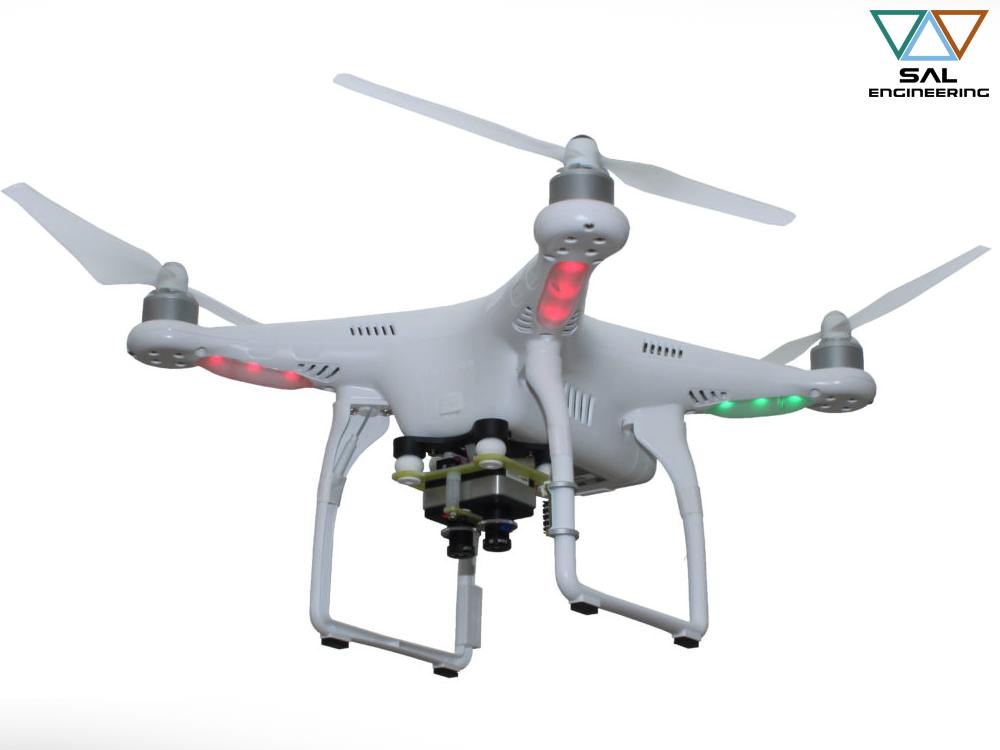
The internal GNSS positioning system provides the precise position of the MAIA multispectral images, but most of all the solution with double GNSS receiver, where one ILS serves as a master base and the other acts as a rover onboard RPAS, gives the possibility to process GNSS data in RTK mode (Real-Time Kinematic), ensuring accuracy close to the centimeter for shots positions.

This aspect triples the speed of photogrammetric processing in the main software based on structure from motion algorythms, and allows to obtain accurate data in a very short time. The RTK solution allows to have an accurate positioning of the center of image, which is fundamental when it is necessary to acquire a sample of images in certain points to investigate a physical phenomenon.


Again, this is of fundamental interest in the field of precision agriculture and environmental protection, where it is important to have a mapping of the conditions ex ante and ex post a natural event, a human action, an unexpected episode, a seasonal evolution.

Agronomic companies, universities and research institutes dealing with agronomic research have for years included data from multispectral survey within the method of data processing and modeling of forecast scenarios.


Come and discover on the dedicated page or on Geo-Matching all the technical features of ILS, the Incident Light Sensor designed for science-based multispectral surveys.

MAIA M2: the modular multispectral camera


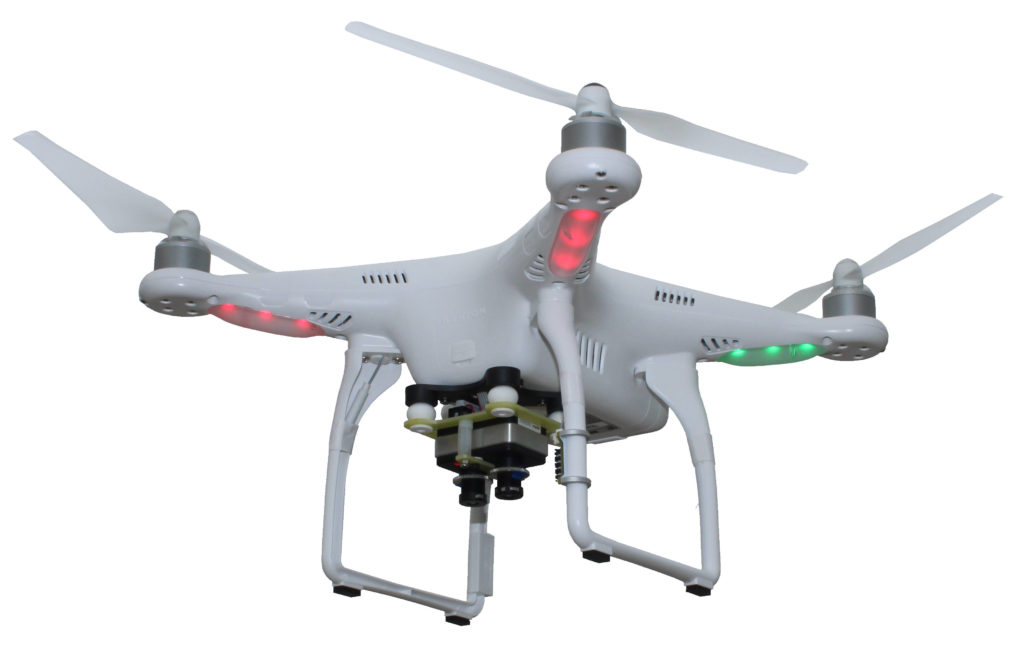
MAIA M2 is the new lightest modular multispectral camera

The potential offered by RPAS (Remotely Piloted Aircraft Systems) in environmental prevention and monitoring is related to the possibility for sensors to fly over areas of interest. In the last decade proximal sensing technology saw a great development both with regard to sensors (lightweight multispectral and iperspectral sensors) and platforms (aircraft, helicopters, RPAS). Research and development in photogrammetric and multispectral surveys is offering new innovative solutions in sensors and technologies to monitor our environmental resources with very high frequency, precision and reliability.

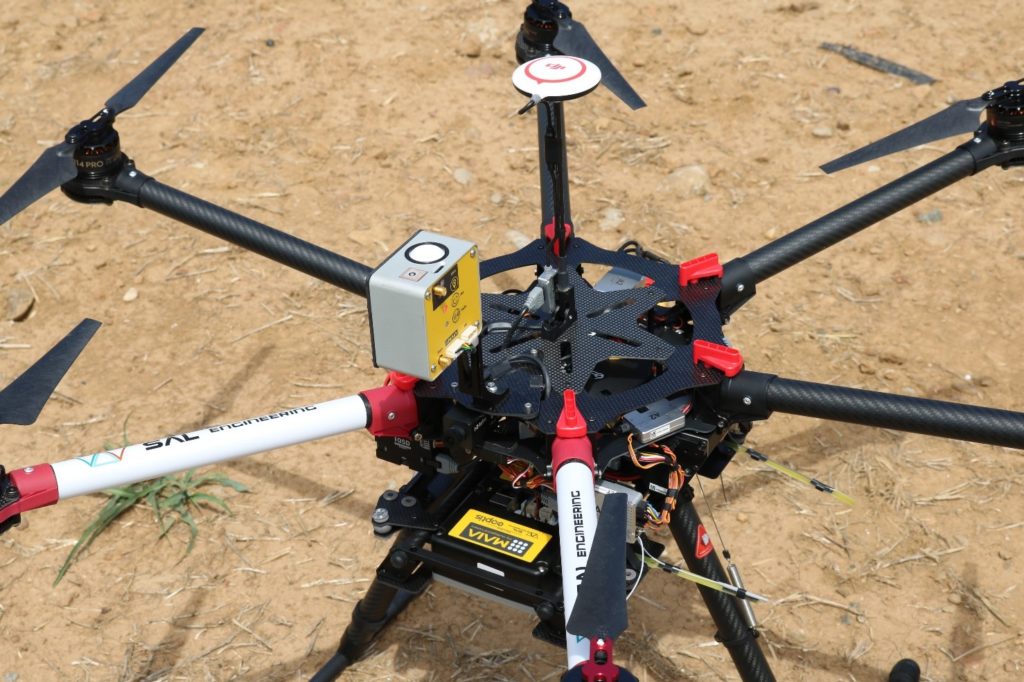
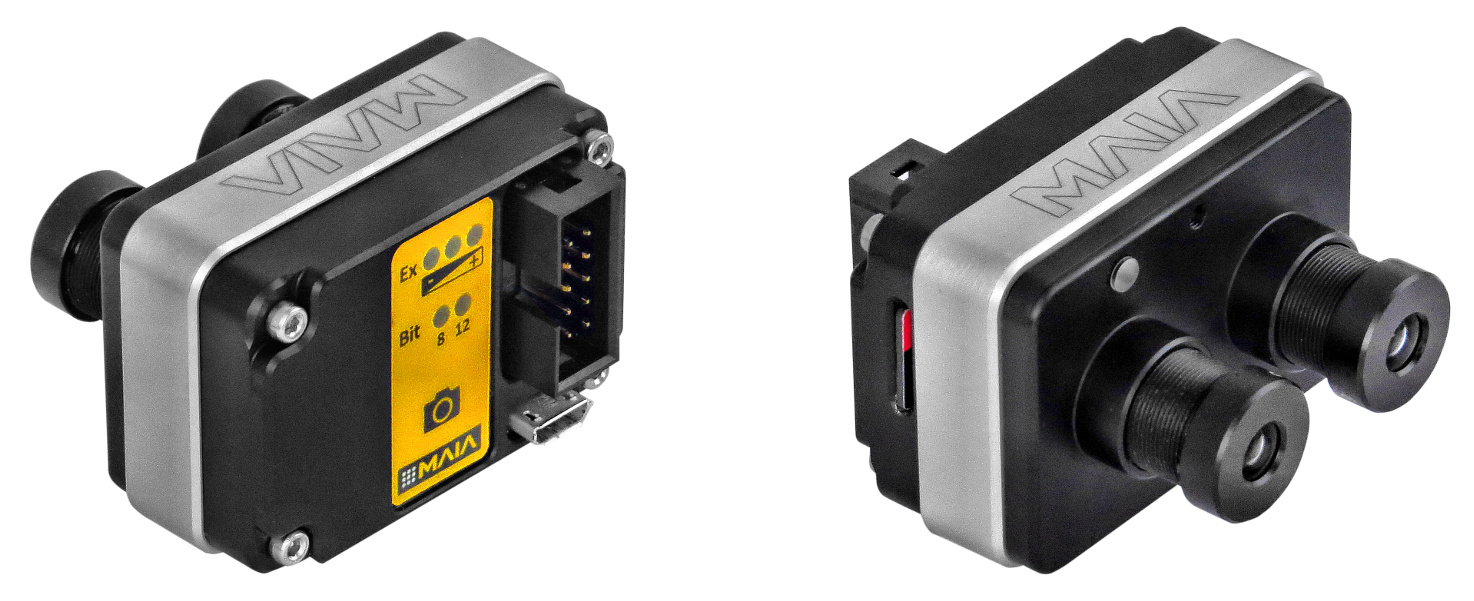
MAIA is the most advanced multispectral camera designed to be employed onboard UAV systems, airplanes and terrestrial rovers as well, jointly developed and made in Italy by SAL Engineering, that designs and manufactures systems for data acquisition in sea, air, land environments, EOPTIS, specialized in designing and manufacturing opto-electronic measurement instruments, and 3DOM Research Unit of Fondazione Bruno Kessler, that is actively involved in accurate measurements and reality-based 3D reconstruction issues. In this team the Italian excellence in the fields of physics, optics, geomatics, 3D modeling and remote sensing have been concentrated: a consolidated know-how was made available for the construction of a multispectral imagery acquisition instrument that could ensure scientific rigor and total control of geometrical and radiometric data for a correct multispectral survey.

Regarding the differentiation of wavelenght intervals along the electromagnetic spectrum, MAIA has been designed according to two main sets: MAIA WV and MAIA S2. Nevertheless, thanks to the profitable collaboration with agronomic consulting companies and environmental protection agencies, or with universities and research institutes, a fully customizable modular solution was subsequently developed.

MAIA M2, in fact, is the new modular multispectral camera that the user can customize with a large portfolio of VIS-NIR bandpass filters, according to his needs.

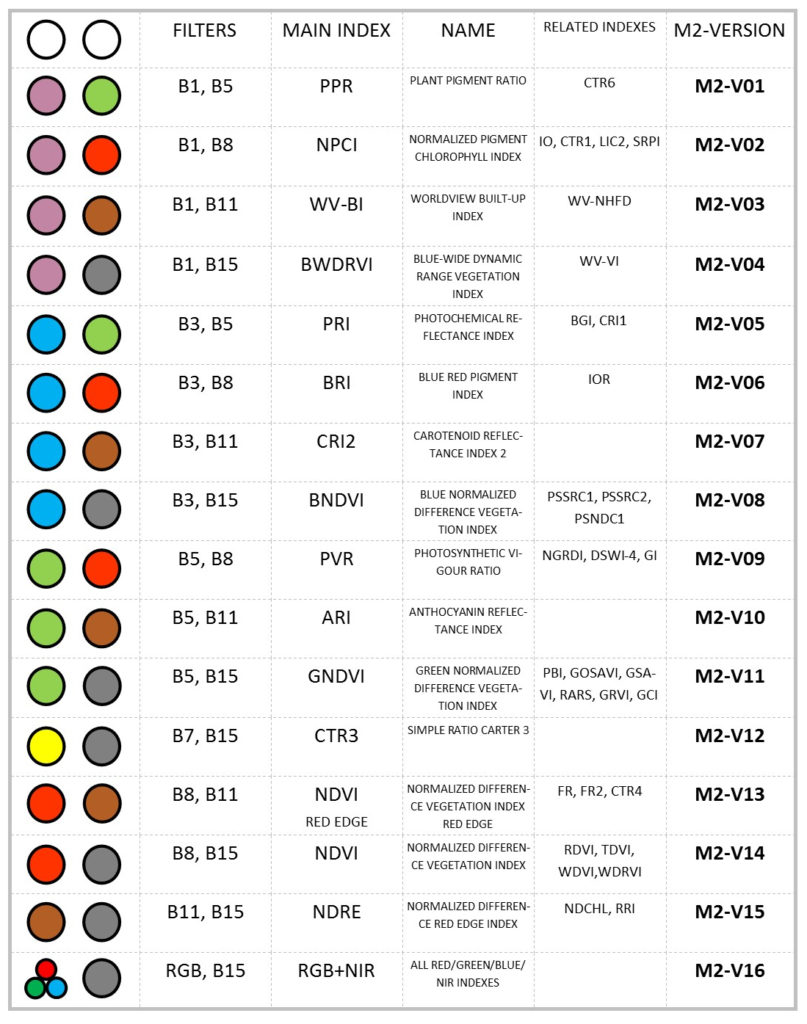
The MAIA M2 single module can be composed using a pair of available band-pass filters. The choice of the pre-selected filter pairs will be made according to the most widely used multispectral indexes with two single bands, or on the basis of the aim of the multispectral survey. In the following table you can see the selected filters that are available in stock:

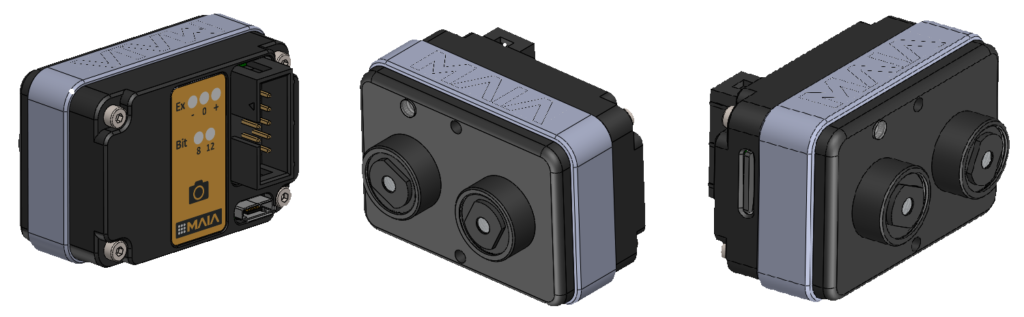
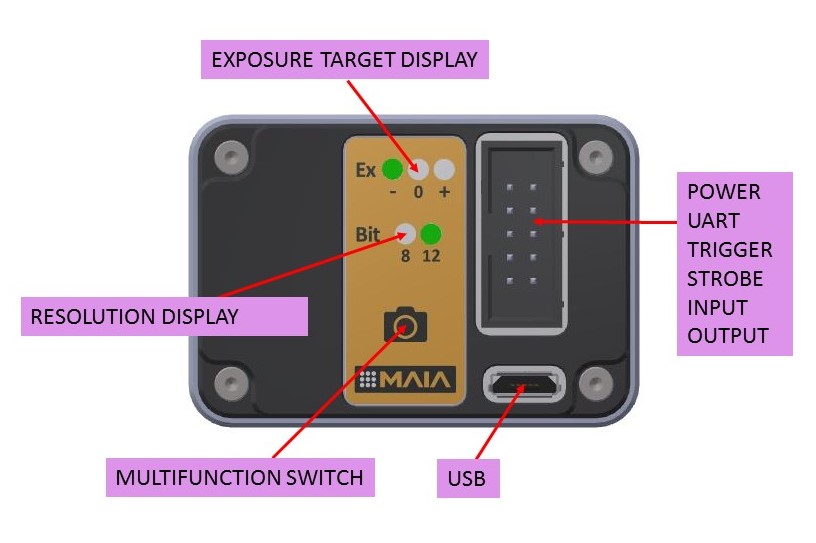
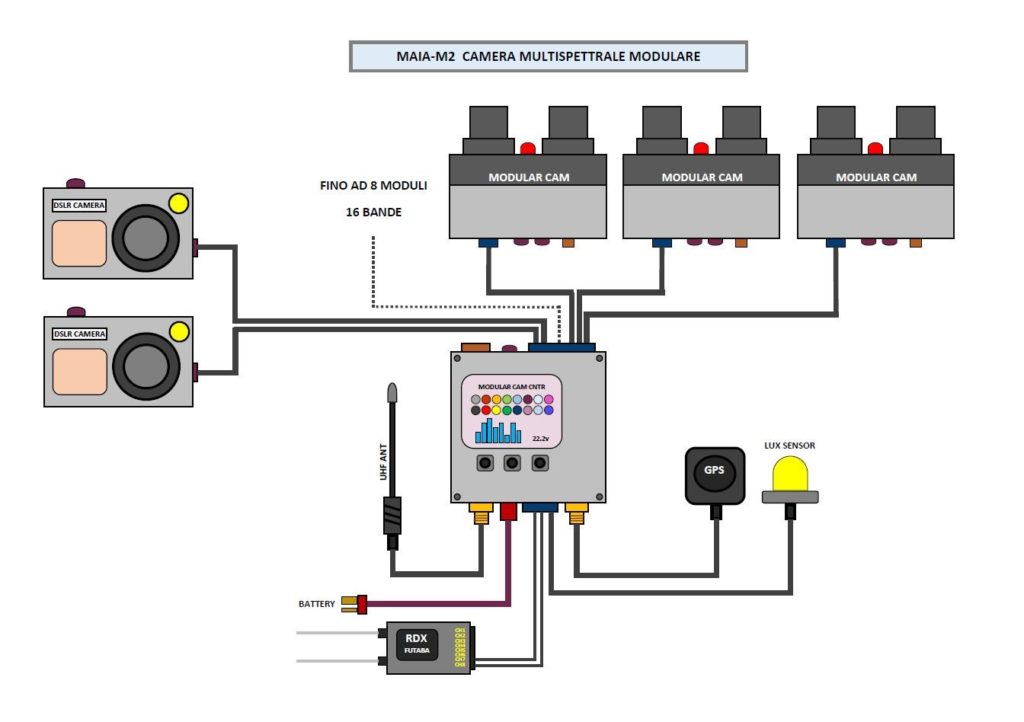
Each module has stand-alone capability with external trigger and strobe or free run mode, and presents several inputs/outputs for external devices interfacing such as trigger, strobe, serial port, USB and two aux port. The module/camera is based on a double global shutter CMOS sensor with 8/12 bits resolution and automatic exposure with selectable target value.

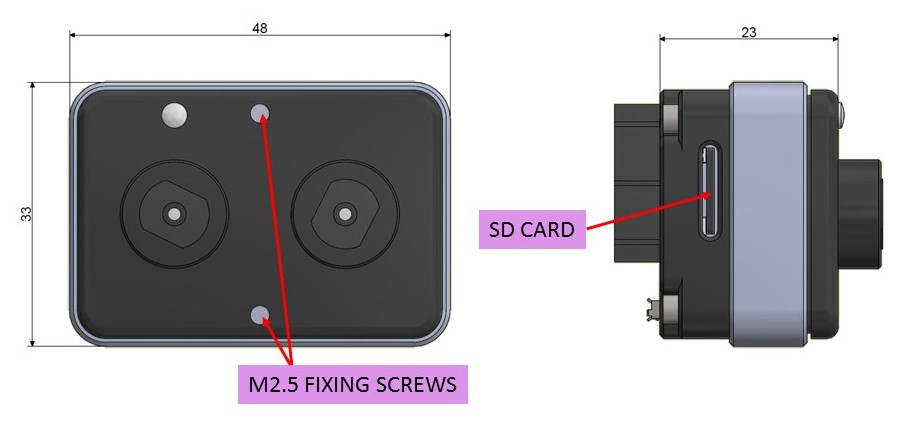
Single module of MAIA M2 has the lowest values in the market of modular multispectral cameras in terms of size (48 mm X 33 mm X 23 mm), weight (70 g) and price (1990 € until July 15th), but it presents the highest values in terms of resolution and sensitivity of sensors.

Multi-module management, up to 8 modules, is possible using the external MAIA M2 Control Unit that manages the images synchronization and geo-referencing, the powering of modules, the reading of PWM inputs, the light sensor input, two outputs with customizable variable advance for delay compensation of any connected DSLR cameras. An RTK version of MAIA M2 Control Unit is supplied including the GNSS antenna, the UHF antenna, the Lux Sensor and the connection cables for batteries, PWM inputs and DSLR shutter input. Multispectral raw images and parameters are stored in a removable SD card, and they can be downloaded from USB in order to be pre-processed with MultiCam Stitcher Pro, the MAIA images pre-processing software.


The following table shows some combinations of 2 or more MAIA M2 modules, useful to allow the calculation of many of the main multispectral indexes:

MAIA is basically the proper instrument for your multispectral survey.

You can detect VIS-NIR informations through 9 global shutter sensors with high resolution and top sensitivity; next, you have the total control on creating your dataset of undistorted and geometrically corrected images for reflectance analysis, indexes calculation and photogrammetric processing. You can then make decisions on monitoring crops, wineyards, forests and coastal environments, in order to safeguard ecosystems and to make your agronomic system more efficient. Along with the camera, an image processing software will be provided for correction of geometric and radial distorsion, for coregistration (pixel-pixel convergence) of RAW multispectral images acquired with MAIA, with tools for indexes calculation and for band combinations.

Since its foundation, SAL Engineering has participated, contributing with the design and management of data acquisition, synchronization and processing systems, to several projects with agronomic and precision farming companies, or environmental protection agencies that deal with natural environments such as coastal dunes, forests, reclaimed sites, areas with high environmental risk.

SAL Engineering is a company specialized in photogrammetric surveys based in Italy: visit our website www.salengineering.it.

For any further information about services and products, send us an email at info@salengineering.it.

For any detailed information about products and technologies that deal with multispectral surveys, please contact usSAL Engineering is providing accurate multispectral data to companies specialized in agronomic consulting thanks to our integrated systems based on platform, control system and sensors.

MAIA WV is the multispectral camera equipped with the same wavelenght intervals of the WorldView-2™ satellite owned by DigitalGlobe. Now, you can compare satellite data with high-resolution maps obtained through a multispectral survey conducted with MAIA WV mounted on your UAV, getting centimeters-level precision and accuracy. WorldView-2™ is a commercial earth observation satellite that provides eight-band multispectral imagery with 1.84 m resolution, in support of services such as agriculture, forest monitoring, land cover changes and natural disaster management. MAIA WV multispectral camera is based on an array of 9 sensors (1 RGB and 8 monochrome with relative band-pass filters) to detect multispectral imagery in the VIS-NIR spectrum from 390 nm to 950 nm: MAIA WV is the most advanced broadband multispectral camera for RPAS, aircrafts, terrestrial rovers available today, with bands in Coastal and Blue spectrum region.

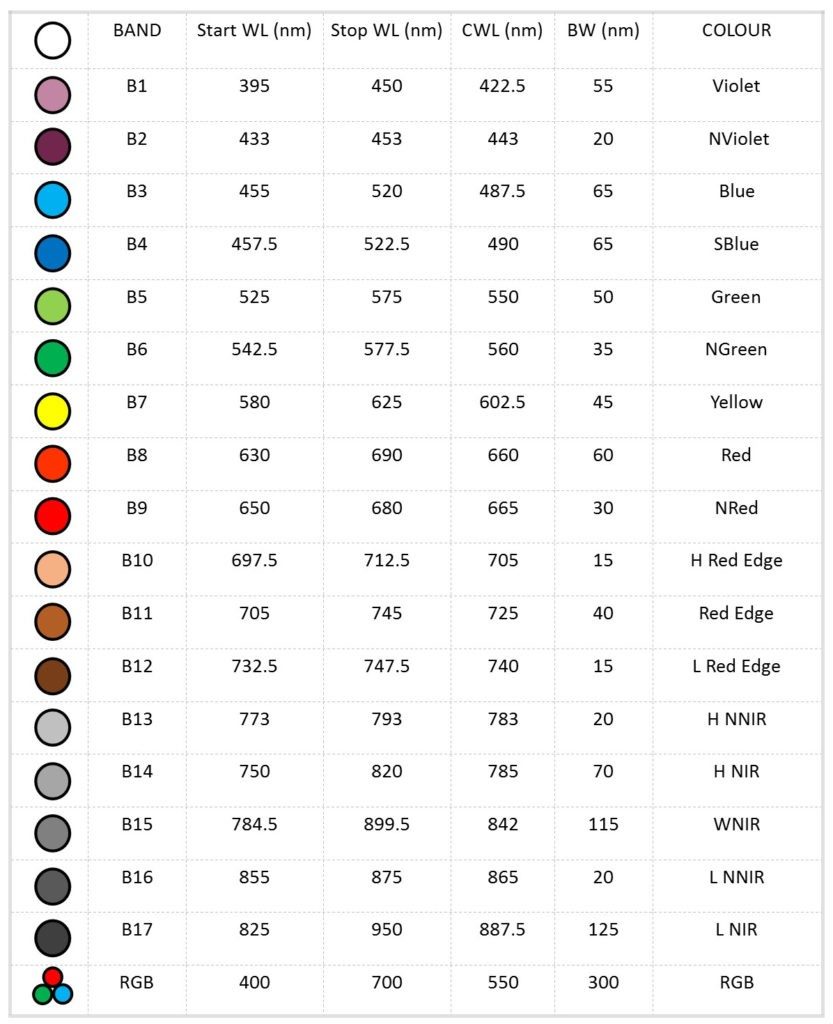
MAIA S2 is the multispectral camera equipped with the same wavelenght intervals of the European Spatial Agency‘s Sentinel-2™ satellite. Sentinel-2™ is an earth observation mission developed by ESA as part of the Copernicus Programme to perform observations in support of services such as precision agriculture, forest monitoring, land cover changes detection, and natural disaster management. Now, you can compare free satellite data with high-resolution maps obtained through a multispectral survey conducted with MAIA S2, the multispectral camera with two narrow spectral bands both in Red Edge and in NIR region.

The key features of the new-born MAIA M2, that presents the same quality of sensors, filters and optics of the standard versions WV and S2, are basically linked to the modular system and to the freedom to customize the set of bandpass filters, with excellent cost/benefit ratio and perfect physical adaptability onboard data acquisition platforms.

Mapping of anthropogenic stress in vegetation and soil


Mapping of anthropogenic stress in vegetation and soil

Techniques of acquisition, processing and interpretation of multispectral data related to key environmental processes such as chlorophylline photosynthesis and plant nutrition, have been refined, especially in relation to the identification and mapping of anthropogenic stress caused by soil infiltration or dispersion of polluting material on the surface. Recent research suggests that there is a distinction recognizable by data acquired through multispectral relief, between natural stress due to, for example, drought and an induced or anthropogenic stress due to soil contamination: this difference is visible in a different physiological response of plants (Zinnert and others, 2012).

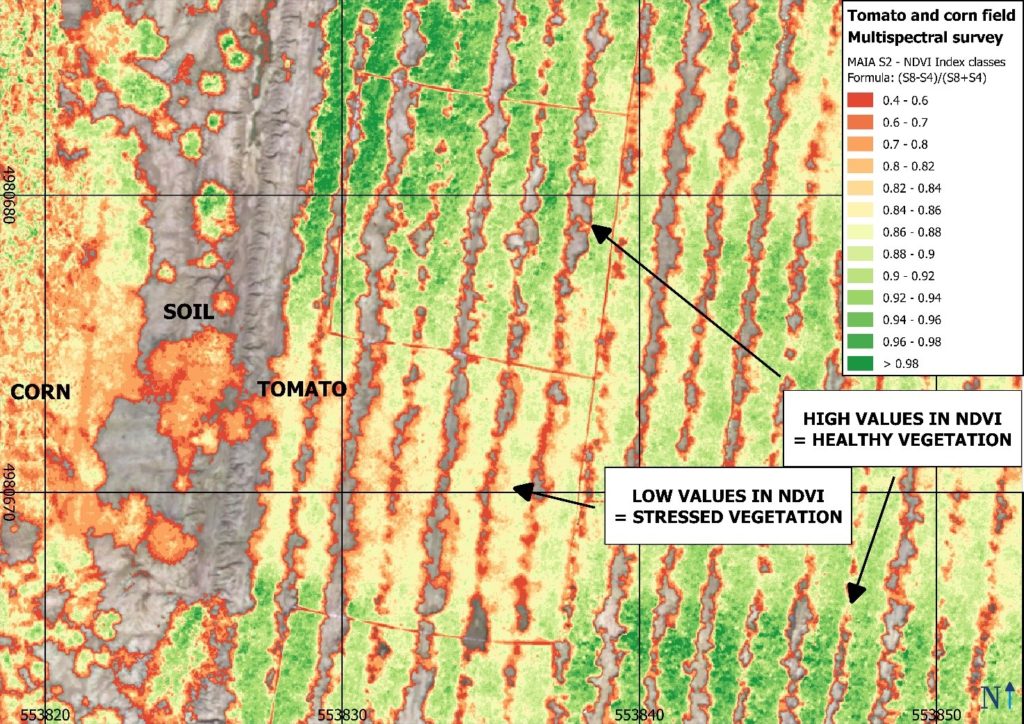
A series of computations between multispectral bands, known as vegetation indices, have been developed and applied in agronomy and environmental sciences to optimize information from multispectral data, which has an increasing geometric, spectral, radiometric and temporal resolution since new acquisition technologies such as RPAS and new sensors have seen significant technological development over the last decades (Thenkabail, 2000).

For environmental and agronomic applications, the bands most involved in the calculations are Red (630 nm to 690 nm), Red Edge (705 nm to 745 nm), NIR (750 nm to 950 nm), Green (525 nm to 575 nm) and Violet (390 nm to 450 nm). The main vegetation indices are the Normalized Differentiation Vegetation Index (NDVI) and its optimizations or transformations such as the Green Normalized Differentiation Vegetation Index (GNDVI), Soil Adjusted Vegetation Index (SAVI) and also in this case including its optimizations such as the TSAVI (Transformed Soil Adjusted Vegetation Index) or the Modified Soil Adjusted Vegetation Index (MSAVI). A very important index for evaluating water content and quality in vegetation and soil is NDWI (Normalized Difference Water Index). By applying the multispectral survey to environmental monitoring of soil matrix or vegetation matrix, these indices are useful for defining growth rates and the vegetative quality of leafy vegetation.

The study of one of these spectral bands, the Red Edge, allows specifically to classify vegetation contaminated by presence in the soil by inflow or gaseous hydrocarbon suspension.

To apply this method of analysis, it is necessary to first correctly classify the vegetation present on the soil and evaluate the moisture content, the species present, the vegetation cover, the leaf cover index, and the surface temperature in different lighting stages and in different seasons. Vegetation growing in soil contaminated by hydrocarbons has visible damages in the Red Edge band, which is the name given to the sudden change in the spectrum region ranging from 680 nm to 730 nm and is caused by a combined effect of a strong incident radiation absorption and strong inner reflection and scattering of the leaf called “leaf internal scattering”.

The shift in the Red Edge reflection of vegetation, which indicates a reduction in plant health or a stress condition linked to anthropogenic contamination, has long been studied and applied to the agronomic and environmental study of cultivated or vegetated areas.

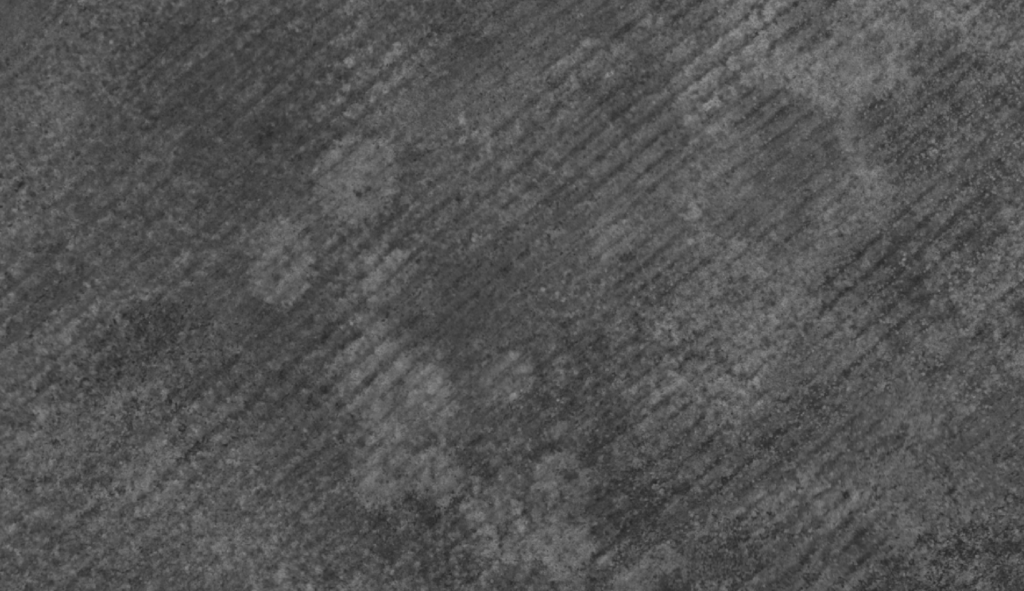
Important tests in this field were carried out by our R&D team on a soil with heavy hydrocarbon contamination: applied remote sensing outputs that were compared in GIS environments were the multi-spectral orthophoto of the 8 bands of MAIA WV, one thermal orthophoto obtained with high resolution thermal camera and an RGB orthophoto always obtained with MAIA’s RGB sensor. With regard to site investigations in collaboration with environmental engineers to which these products serve as mapping basis for macro-assessment of contamination problems, it was possible to identify and map vegetal anomalies related to the presence of hydrocarbons in the soil, also found in a variation in surface temperature, as well as in a different reflection in the NIR band and, as previously mentioned, particularly in the Red Edge band, and in some indexes.

Figure 1: Detail of the Red Edge band image of a terrain with hydrocarbon contamination.
Figure 2: Detail of a thermal orthophoto of a terrain that is contaminated by hydrocarbons.
Figure 3: Detail of a RGB Orthophoto of a terrain that is contaminated by hydrocarbons.

The field activity is supported by valid scientific publications (Noomen, 2003 & 2008), in which the high-quality method is certified and in which there is evidence of high susceptibility of crops in the presence of gaseous hydrocarbons deposited on the ground or surface stagnation, and more specifically in the presence of Ethane gas (C2H6): cultures exposed to this gas are more spectrally reflected in bandwidths ranging from 570 nm to 700 nm (Noomen 2008).

Thanks to the multispectral survey made with MAIA WV, it is also possible to detect an accentuated concentration of metals in the soil matrix. Wu et al. (2007) demonstrated that spectroscopy in visible and near infrared regions has a strong negative correlation with certain metals (Cadmium, Chrome, Copper, Mercury, Lead, Zinc) in contaminated soils, depending on the presence iron oxide and carbon content. Chloe et al. (2008) and Wu et al. (2008) continued fruitful research on the use of multispectral remote sensing to diagnose the presence of high concentrations of certain metals in contaminated soils.

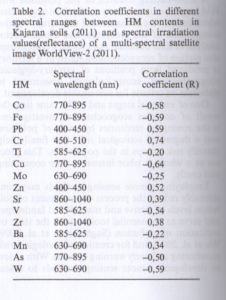
Other scientific studies (Asmaryan et al 2014) confirm the positive correlations between the presence of chromium, lead and zinc measured in the site and detected by multispectral survey, on non-vegetated soil (whose NDVI index by definition goes from 0 to 0.3). The same studies have identified specific reflectance values at certain wavelengths of certain metals in the soil matrix, as shown in the table.


Figure 4: Correlation in different spectral ranges between metal content in non-plant soil and spectral values derived from a WorldView-2 satellite image.

Concerning the multispectral knowledge of the ground matrix, MAIA WV images, related to the wavelength ranges of satellites investigating the spectrum from visible to infrared such as Landsat TM, World-View 2 and Sentinel-2, can be processed to locate and map a large set of minerals, including iron oxides, clays, and other hydroxyl minerals that are often in nature at hydrothermal alterations in the outcrops (Source: Andrea G. Fabbri, Gabor Gaál, Richard B. McCammon, Deployment and Geoenvironmental Models for Resource Exploitation and Environmental Security, Springer Science & Business Media, 2012).


“Sensors of monitoring, from theory to field” on L’Informatore Agrario journal

“Sensors of monitoring, from theory to field” on L’ Informatore Agrario journal

We proudly share this article written by Francesco Marinello (Dipartimento Tesaf – Università di Padova and Neos srl), Marco Sozzi (Dipartimento Tesaf – Università di Padova) and Alessia Cogato (Dipartimento Tesaf – Università di Padova and Isiss G.B. Cerletti di Conegliano-Treviso) and published on the magazine L’Informatore Agrario (© 2018 Copyright Edizioni L’Informatore Agrario S.r.l.) concerning the characteristics of some multispectral sensors and their applications in Precision Agriculture.

The maps provided by multispectral sensors can be used for monitor the evolution of the crop cycle and, correlated with information on soil and weather and yields of the previous cycles, can be used to perform zonations and to create simulations. These operations are essential to predict productive trends and therefore to optimize treatments and agronomic inputs in the different areas identified.

Compared to satellites and proximal sensors, drones have peculiarity in flexibility of survey: this is fundamental in some phytosanitary or weeding treatments.

You can read and download the full article by clicking the link below.

Sensori di monitoraggio, dalla teoria al campo by L’Informatore Agrario


Credits: L’Informatore Agrario © 2018 Copyright Edizioni L’Informatore Agrario S.r.l.

Francesco Marinello, Luigi Sartori
Dipartimento Tesaf – Università di Padova e Neos srl

Marco Sozzi (Dipartimento Tesaf – Università di Padova)

Alessia Cogato (Dipartimento Tesaf – Università di Padova and Isiss G.B. Cerletti di Conegliano-Treviso)

“Geometric calibration and radiometric correction of the MAIA Multispectral Camera” on ISPRS Archives

Geometric calibration and radiometric correction of the MAIA Multispectral Camera

As a result of the Conference “Frontiers in Spectral imaging and 3D Technologies for Geospatial Solutions” that took place in Jyväskylä, Finland, on 25-27 October 2017, a paper has been discussed, published and scientifically reviewed. The title of the article is “Geometric calibration and radiometric correction of the MAIA Multispectral Camera” and it is published on “The International Archives of the Photogrammetry, Remote Sensing and Spatial Information Sciences, Volume XLII-3/W3, 2017”.  This article has been peer-reviewed.

Multispectral imaging is a widely used remote sensing technique, whose applications range from agriculture to environmental monitoring, from food quality check to cultural heritage diagnostic. A variety of multispectral imaging sensors are available on the market, many of them designed to be mounted on different platform, especially small drones. This work focuses on the geometric and radiometric characterization of a brand-new, lightweight, low-cost multispectral camera called MAIA. The MAIA camera is equipped with nine sensors, allowing for the acquisition of images in the visible and near infrared parts of the electromagnetic spectrum.
You can read and download the paper by clicking on the link below.

“Which future for the employment of drones in agriculture?” on L’Informatore Agrario

“Which future for the employment of drones in Agriculture?” on L’Informatore agrario journal

We proudly share this article written by Francesco Marinello, Luigi Sartori (Dipartimento Tesaf – Università di Padova and Neos srl) and Simone Gatto (Dipartimento Tesaf – Università di Padova) and published on the magazine L’Informatore Agrario n°39 (© 2017 Copyright Edizioni L’Informatore Agrario S.r.l.) concerning the benefits of multispectral survey and of other survey tecnologies for Precision Agriculture. Here is a statement in which they talk about MAIA – The Multispectral Camera.

“Multispectral cameras are more and more useful instruments in Precision Agriculture. Their flexibility in use increases with the number of bands available. For example, MAIA (one of the most interesting instruments on the market, realized by SAL Engineering) with 9 monochromatic sensors in 9 different bands permits to calculate over 20 vegetational indices among the most common. Those indices are efficient in Precision Agriculture to define agronomical interventions in different vegetative moments of the colture, thanks to the support given by the prescription maps, in the planning of time and distribution of the harvest, in recognizing health deseases or points of maturation, and in general to evaluate the vegetative health status of the colture”.

You can read and download the full article by clicking the link below.

2017 39 Informatore Agrario

Credits:

L’Informatore Agrario © 2017 Copyright Edizioni L’Informatore Agrario S.r.l.

Francesco Marinello, Luigi Sartori
Dipartimento Tesaf – Università di Padova e Neos srl
Simone Gatto
Dipartimento Tesaf – Università di Padova

Applications of MAIA for environmental monitoring


Applications of MAIA the multispectral camera for environmental monitoring

The potential offered by RPAS in environmental awareness, prevention and monitoring is related to the possibility for sensors to fly over areas of interest. Remote Sensing in the environmental and territorial sector has undergone the first strong development with the NASA launch of the Landsat1 satellite in 1972, and since then numerous Earth Observation projects have been launched by numerous public and private space agencies.

In the last decade Proximity Remote Sensing technology saw its great development both with regard to sensors (lightweight multispectral and iperspectral sensors) and platforms (aircraft, balloons, helicopters, RPAS).

The platform is always equipped with a sensor, which can be active or passive. An active sensor emits electromagnetic radiation in the optical region, such as a LIDAR (Light Detection And Ranging) sensor, or SAR (Synthetic Aperture Radar): energy is reflected from the Earth’s surface and returns to the sensor where measurement is done. A passive sensor measures the physical and chemical data of the earth’s surface or the atmosphere on the basis of the reflected solar electromagnetic radiation or directly emitted by the objects in the investigated surface. A passive sensor can be optical or other type, such as those measuring meteorological parameters, air quality or ionizing or non-ionizing radiation. An optical sensor is characterized by the particular spectral region, within the entire electromagnetic spectrum, where the instrument works. The spectral region may include Visible (VIS), Near Infrared (NIR), Average Infrared (SWIR) and Thermal Infrared (TIR).

Figure 1 Electromagnetic spectrum in which the infrared regions are highlighted.
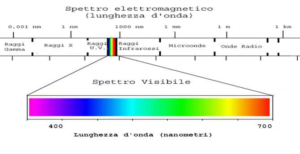
Figure 2 Electromagnetic spectrum in which the visible spectral region of the Visible is highlighted.

The number of its spectral bands characterizes an optical sensor: a panchromatic sensor operates in the visible region, a multispectral sensor provides images at different bandwidths and hence wavelengths, and a hyperspectral sensor is equipped with hundreds of very narrow bands.

The fundamental properties of the sensors are the geometric resolution, defined by the pixel size and therefore the ground information unit, the spectral resolution, i.e. the amplitude and variety of the bands, and the radiometric resolution, that is the sensitivity in the measurement that is able to return. The repetition rate of data acquisition finally defines the time resolution, which depends on the platform and not on the sensor.

MAIA WV is the multispectral camera with 9 sensors designed and developed with bands that have the same wavelength ranges as DigitalGlobe’s WorldView-2 satellite. It consists of an RGB sensor for real-life images, and 8 monochrome sensors with VIS-NIR spectrum sensitivity from 390 nm to 950 nm. Each sensor has a resolution of 1280×960 pixels (1.2 Megapixels) and the size of each sensor pixel is 3.75 μm x 3.75 μm. Monochrome sensors are coupled with band-pass filters that determine undesired wavelengths.

Figure 3 Electromagnetic Spectrum Detectable by MAIA WV-2 with relative wavelength intervals of the different spectral bands.

MAIA S2 is the 9-sensor multispectral chamber designed and developed to have 9 bands at the same wavelengths as ESA’s Sentinel-2 satellite. Each sensor has a resolution of 1280×960 pixels (1.2 Megapixels) and the size of each sensor pixel is 3.75 μm x 3.75 μm. Monochrome sensors are coupled with band-pass filters that determine undesired wavelengths.

Figure 4 Electromagnetic Spectrum Detectable by MAIA S2 with relative wavelength intervals of the different spectral bands.

Multispectral survey results are images unaffected by radial and geometric distortion, which present the pixel-pixel coregistration of information for all bands. Through the image processing software acquired with MAIA WV and MAIA S2, it is also possible to operate a radiometric correction of the multispectral data to obtain a repeatable and comparable data even under different light and environmental conditions.

For this reason, SAL Engineering and Eoptis have patented and developed ILS – Incident Light Sensor, an incident light sensor that records incident environmental radiation at every single shoot so that the multispectral data can be radiometrically corrected under the conditions of real and contingent lighting.

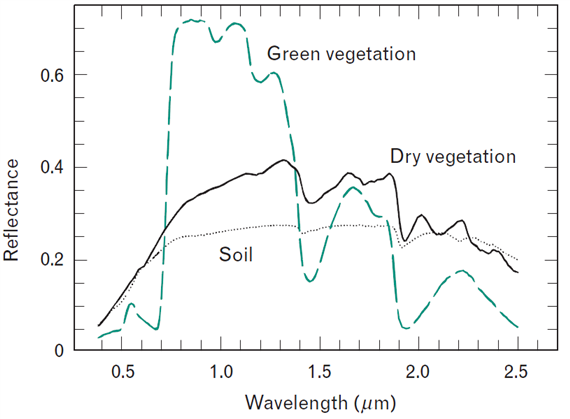
Different types of surface such as water, bare soil, or vegetation reflect radiation differently at the different wavelength ranges that define spectral bands: in this sense, the reflected radiation according to the wavelength is called spectral signature of the surface, which is proper and recognizable for certain elements and surfaces.
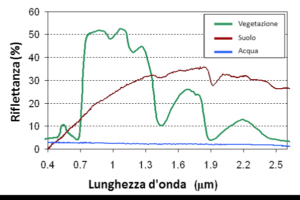
Figure 5 Spectral signature or spectral profile of vegetation, soil and water.

The vegetation has a very high reflection value in the near infrared and a low reflection value in the red channel of the visible: this allows for example to easily distinguish vegetation areas from those with bare soil through the RVI ( Ratio Vegetation Index), which is the ratio between quantified reflectance in NIR digital numbers and reflection in Red images.

Figure 6 Spectral sign of vegetation in the Visible and Near Infrared region.

It is possible to distinguish the dry vegetation from the wet vegetation, or to investigate the health of a crop by analyzing the curve of its spectral signature.

Dry vegetation does not absorb the red radiation typical of active photosynthesis, does not have the typical Red Edge reflection peak and does not exhibit the high reflection of NIR’s typical radiation incident.

The spectral signature of green plants is very characteristic: chlorophyll in a growing plant absorbs light in the visible, especially red, which it uses in photosynthesis. The near infrared light, on the contrary, is reflected very effectively because it does not serve the plant in any way: in this way the plants avoid excessive heating and evaporation of the lymph.

The vegetation reflection in the near infrared ranges and in the ranges of the visible varies considerably. The degree of difference reveals the extent of leafy vegetation in a portion of an area: in this sense a very important index is the Leaf Area Index (LAI), which is a very useful foliar index in agriculture and in management, for example, of a degraded area that has been regenerated or reclaimed.
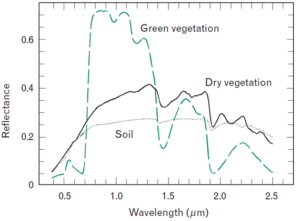
Figure 7 Spectral differences, recognizable in their spectral signature, dry vegetation and active photosynthesis vegetation.

The vegetation can be classified according to the specific spectral signature of the different plant species: in fact, research on quantitative biomass estimation and on the classification and monitoring of the tree species has already been carried out for decades thanks to multispectral surveys based on different spectral signatures of the tree species.
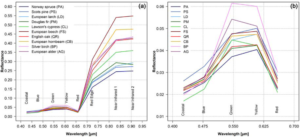
Figure 8 Different tree species classified according to their characteristic spectral signature.

Figure 9 Distinction of spectral reflection characteristics of conifers and hardwoods in the specific region of the Red Edge.

Each plant species and each agrarian culture is characterized by a specific phenological schedule. Multitemporal Remote Sensing allows you to observe phenological evolution during the year, and by comparing and predicting, to implement a plan for the prevention and monitoring of crops and the protection of natural forest, shelter, marsh or mountain ecosystems.
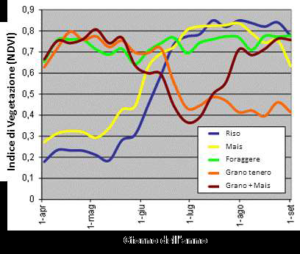
Figure 10 Distinctions in spectral reflectance characteristics between different crops.

There are also significant differences between different types of soil, in fact the multispectral survey is a large scale survey also used for the classification of geological soil: different mineral and lithological elements for their physical and chemical composition present a definite spectral signature. You can read a summary of applications of multispectral survey here. In addition, as with vegetation, it is possible to distinguish in terms of reflection a soil with high humidity from an arid soil because a soil with higher water content has a higher absorption of the incident and diffused radiation.
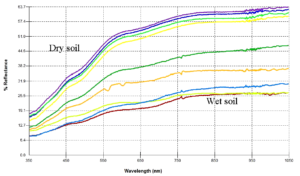
Figure 11 Distinction in spectral reflection between arid soil and wet soil.

Another very important matrix to be analyzed from a spectrometric point of view is water, whose variations in terms of spectral signature may characterize turbidity, the presence of suspended materials, or even contamination or the unexpected or unusual presence of suspended materials, or excessive or reduced production of phytoplankton in suspension. Generally water has minimal reflection only in the spectrum of the visible, and more precisely in the band of Blue and Violet. The reflection at these specified wavelength intervals allows a certain depth of penetration in the survey below the surface of the water bodies. With MAIA S2, equipped with a bandpass filter set that allows you to capture images at the same wavelengths of the ESA satellite Sentinel-2, and with MAIA in its WV filter set, that allow to capture multispectral data at the same wavelengths of the WorldView-2 satellite, it is possible to evaluate some water quality parameters:

  • the concentration of suspended chlorophyll
  • the presence of harmful algal blooms
  • salinity and turbidity
  • state of pollution or contamination of a water body.

It is also possible to distinguish within the flora in a water body, different species based on different reflection in the wavelengths of Blue and Violet. This knowledge is conducive to the safety assessment in all the exploitation activities that man will be able to implement of that water resource.
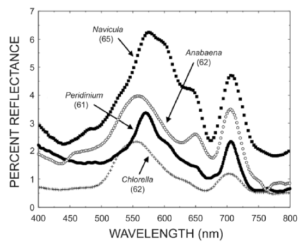
Figure 12 Comparison of spectra reflecting the taxonomies of four different algae in a water body, with almost identical chlorophyll concentration (written in parenthesis and expressed in μg / l).

In this report we also present high-quality scientific applications that the Research Institutes, Universities and Environmental Agencies have successfully tested, adding multispectral survey to well-established survey techniques, and in particular correlating information from precious multispectral data to the information already sought and documented in different fields of investigation of environmental science and knowledge of the territory.

The main measurements that can be obtained through a multispectral survey carried out with MAIA, concern:


Vegetation –        Discrimination and classification of species
–        Estimation of biomass
–        Plant health status
–        Potential evapotranspiration
–        Real evapotranspiration
Soil –        Discrimination between different types of soil
–        Content of organic matter
water –        Content of turbidity
–        Concentration of chlorophyll
Anthropized –        Discrimination and classification of land use


With regard to the sensors that SAL Engineering can make fly over the areas of interest, the main applications useful to an Environmental Protection Agency can be:


MAIA and MAIA S2

The Multispectral Camera

·        Classification of vegetation and health monitoring based on biophysical parameters; vegetation indices.
·        Identification and classification of land use, soil types, vegetation and crops with their health status.

·        Analysis of the correlation between vegetation typologies and geomorphological aspects.

·        Issues on agricultural production.

·        Evaluation of the environmental impact of the burned and then repopulated regions; tools for VIA (Environmental Impact Assessment) and VAS (Strategic Environmental Assessment).
·        Identification of unauthorized waste areas; monitoring of RSU dumps; identification of biogas emissions, location of percolate leakage and assessment of the health status of the surrounding vegetation.
·        Spill analysis found in water bodies; thermal behavior of surface water, mapping of algal types and their diffusion, torpidity and color of water, identification of paleoalve.
·        Digital 3D model of surface and ground; topographic profiles, level curves; orthophoto RGB and multispectral area of the area of interest.
Thermal camera TIR ·        Thermal mapping of vegetation and crop anomalies.
·        Identification of areas with greatest fire risk; prediction areas of propagation; ongoing fire analysis.
·        Identification of spills of external material in water bodies; identification of floating or suspended material in water bodies.
·        Locating and mapping zones with thermal anomalies or differentials in landfill areas.
·        Creating georeferenced thermal video with database creation in GIS environment.
High-Res Video camera ·        Creating video insights of phenomena and objects in inaccessible, dangerous areas. Creating geo-referenced videos with database creation in GIS environment.
GAS Sensor ·        Measurement of the quantity of certain GASs for the determination of air quality.
·        Control the air quality during and after a fire in the areas adjacent to the event. Prediction of propagation areas during a fire.

In the table above, applications of an aerial thermographic survey for environmental monitoring were reported, and we have previously reported the utility of correlating the multispectral data to a surface temperature evaluation of some objects and surfaces of interest. In fact, in the field of environmental protection, the applications of the RPAS thermal relief are numerous and in continuous exploration:

  • It is possible to detect on the soil or in a forest any variation of temperature useful for the botanical or vegetative study of the species, and above all, to the prevention of fires and their propagation
  • Water infiltration can be detected in landslides, rainwater can be monitored and remediation operations can be monitored.
  • It is possible to detect thermal anomalies in free, woody or cultivated soils for the study of soil composition, to identify the coordinates of certain areas for possible geotechnical, geodynamic and geoelectric operations.


The RPAS thermographic survey has important application and development in the landfill areas, especially if the thermal orthophoto can be correlated with a multispectral orthophoto so as to associate to each pixel and thus to every small portion of the ground radiometric information thermal and multispectral.

The joint multispectral survey, as well as to identify and map the presence of hydrocarbons in the soil, serves to define and characterize the causes of the detected surface temperature differences.


In conclusion, by referring them to the reference environmental theme, below are the measurements and information that can be obtained by means of a survey conducted by SAL Engineering using MAIA optionally matched to a thermographic sensor:

Water quality Monitoring of eutrophic phenomena in water bodies such as mucilage, harmful algal blooms, chlorophyll content, suspended phytoplankton analysis or floating material analysis.
Identification and identification of drains in water bodies.
Soil quality Estimate organic content in the soil; identification and classification of minerals and metals in the soil.
Identification and mapping of underground or natural anthropic structures.
Hydrology, climate, agrometeorology Estimation of volumetric variations of glaciers; monitoring of frontal and periglacial areas.
Classification of phenological status of crops.
Mapping of nitrogen requirements in crops.
Estimating the water needs of crops.
Estimation of real and potential evapotranspiration.
Monitoring soil moisture.
Evaluation of damage from extreme atmospheric events, such as horns or air trumpets.
Dams, lamination basins Measurement of sediment volume.
Evaluation of the impact of the tax on water bodies downstream of the operations: assessment of torpidity, volumetric assessment of sediments.
Conservation of ecosystems Monitoring of vegetation remediation.
Monitoring of natural ecosystems.
Monitoring and prevention of peat fires.
Monitoring the phytosanitary and phenological status of natural vegetation.
Construction sites Estimated volumes of lands and rocks moved.
Monitor environmental impacts on natural vegetation and verify the correct restoration of the site at the end of the work.
Air quality Measurement of air quality parameters near industrial plants and landfills.
Geological instability Plano-altimetric survey of landslides, even on vertical walls.
Monitoring of infiltrations and water circulation within rocky bodies; identification of cracks, faults.
Avalanche Mapping areas of avalanche and estimating accumulation volumes.
Quarries Estimates volumes captured at predefined timeframes.
Verification of the correct restoration of the decommissioned quarries.
Landfills Inspection of preliminary excavations; Insulation control and waterproofing and anti-infiltration.
Checked volumes and volumetric estimates.
Locating and mapping the percolation and multispectral analysis of the percussion physico-chemical composition.
Identification and analysis of biogas emissions from RSU dumps.
Identification of abusive landfills by analysis of alterations in vegetation or in surface soil.

Multispectral survey for precision viticulture

Multispectral survey for precision viticulture

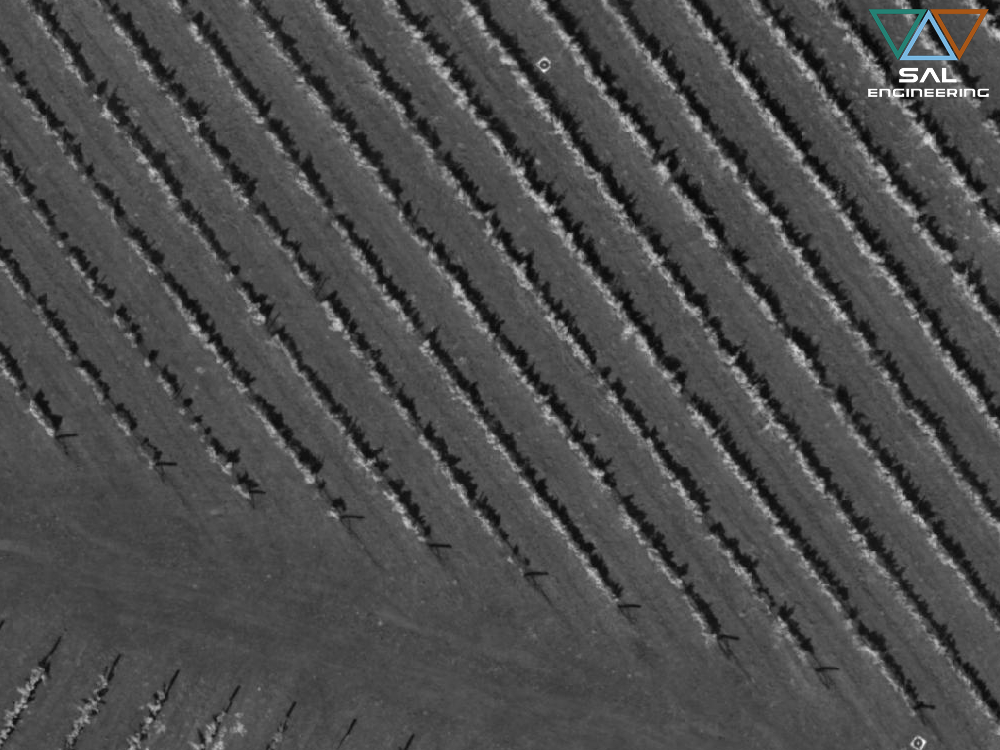
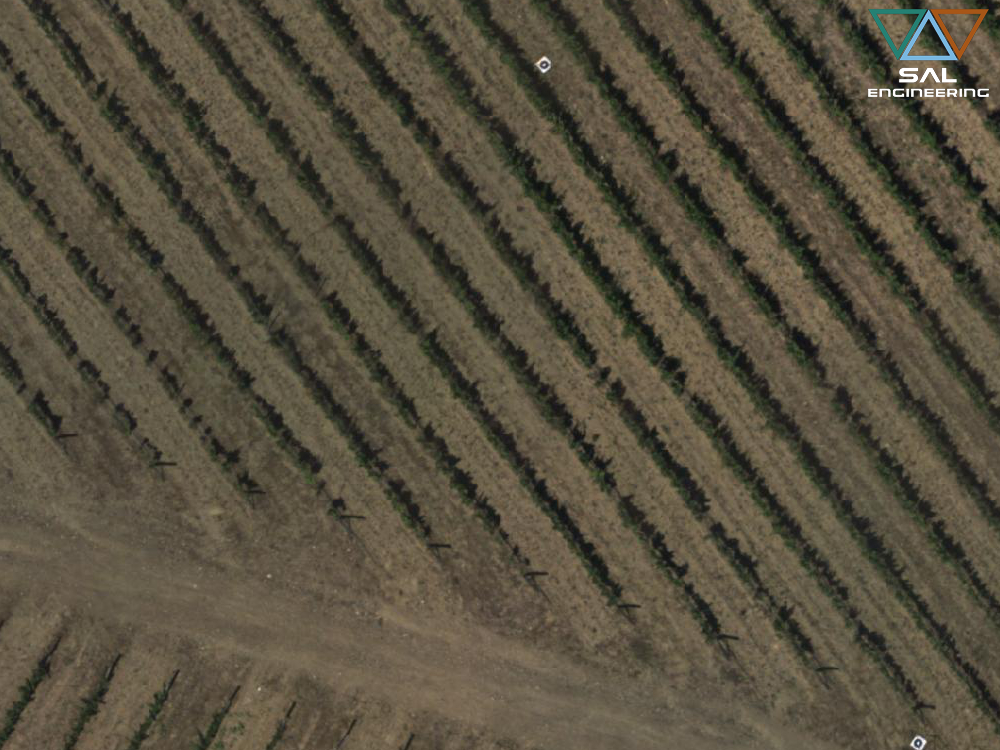
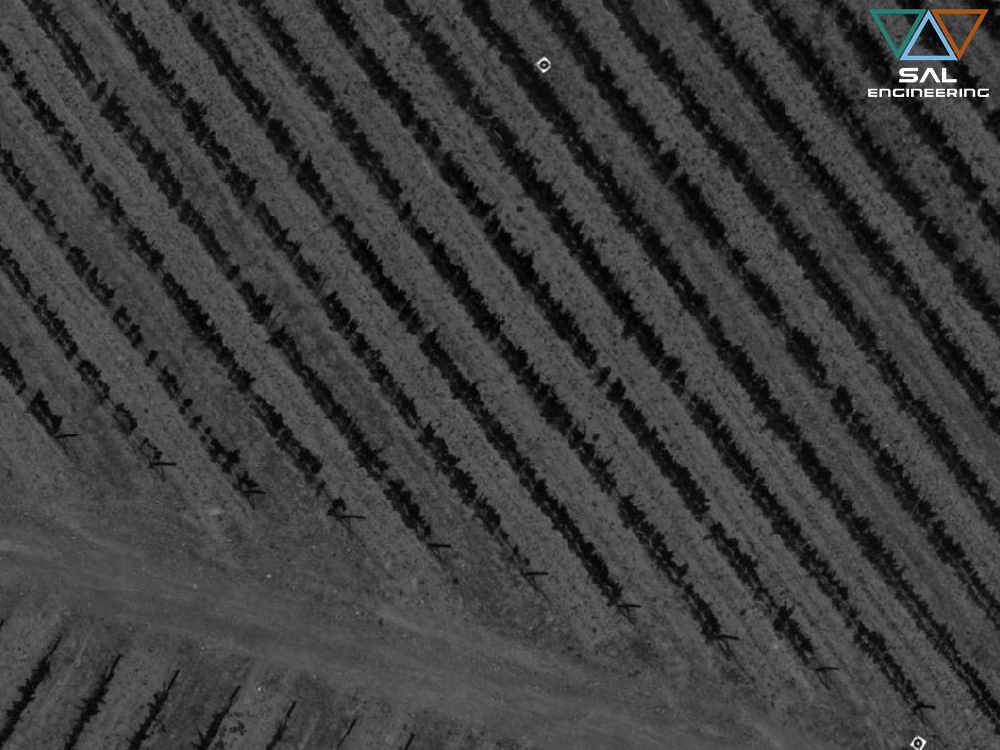
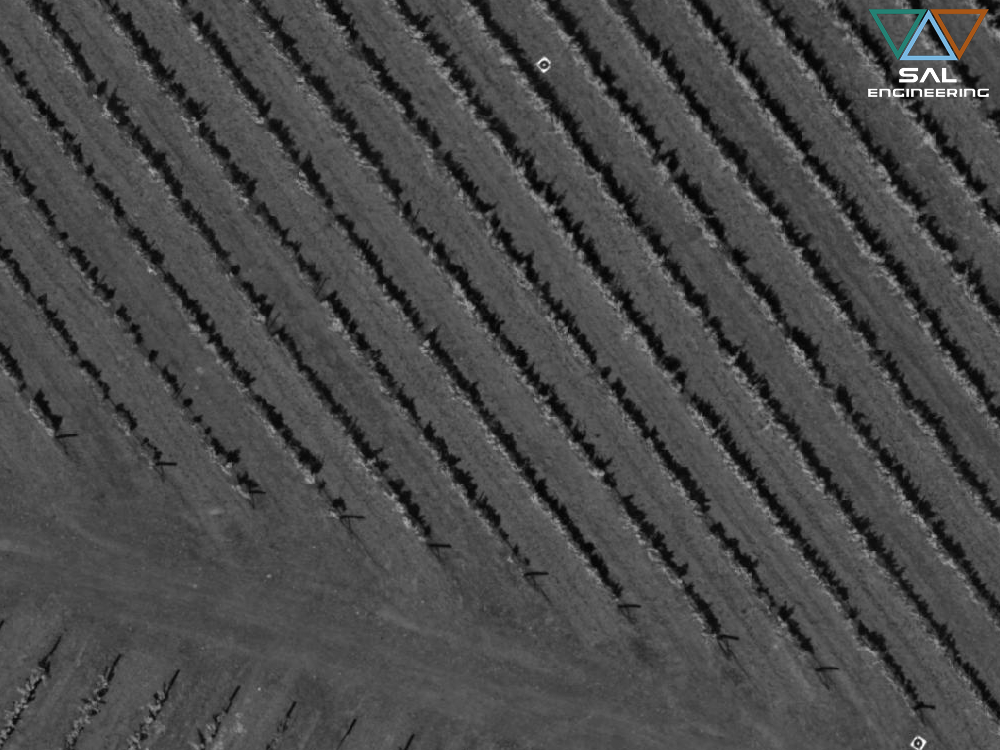
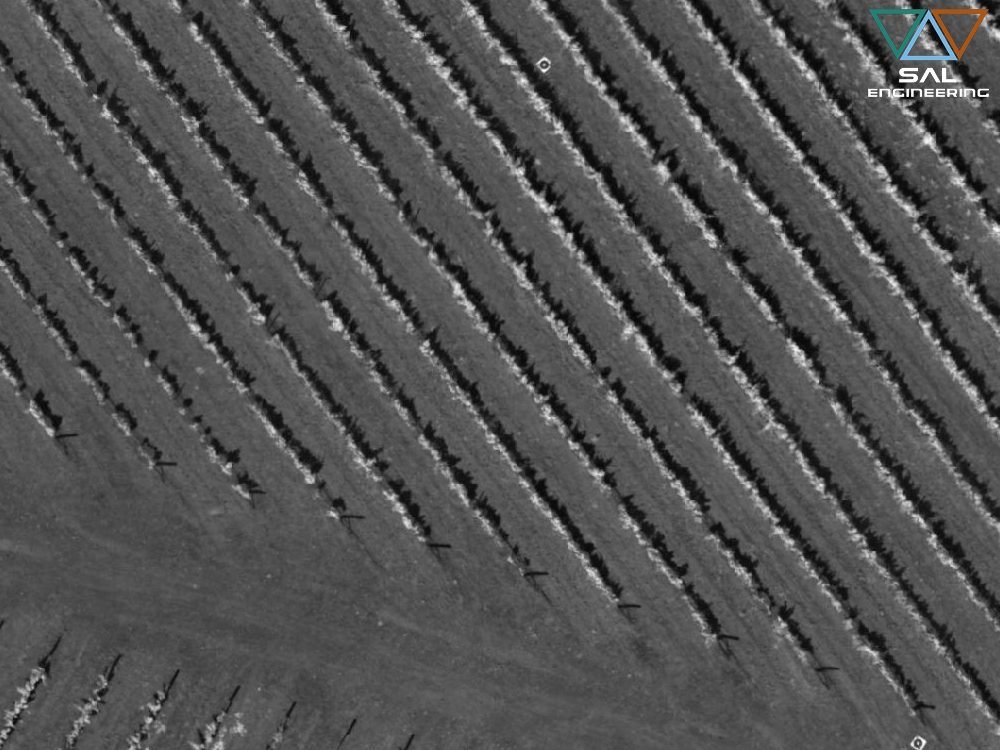
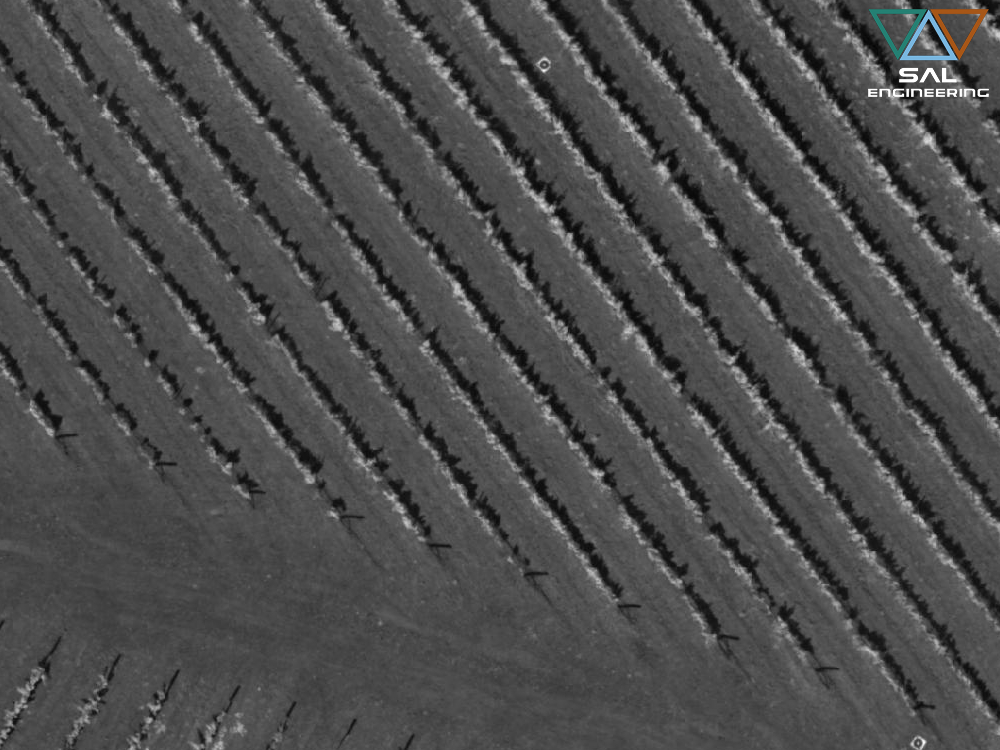
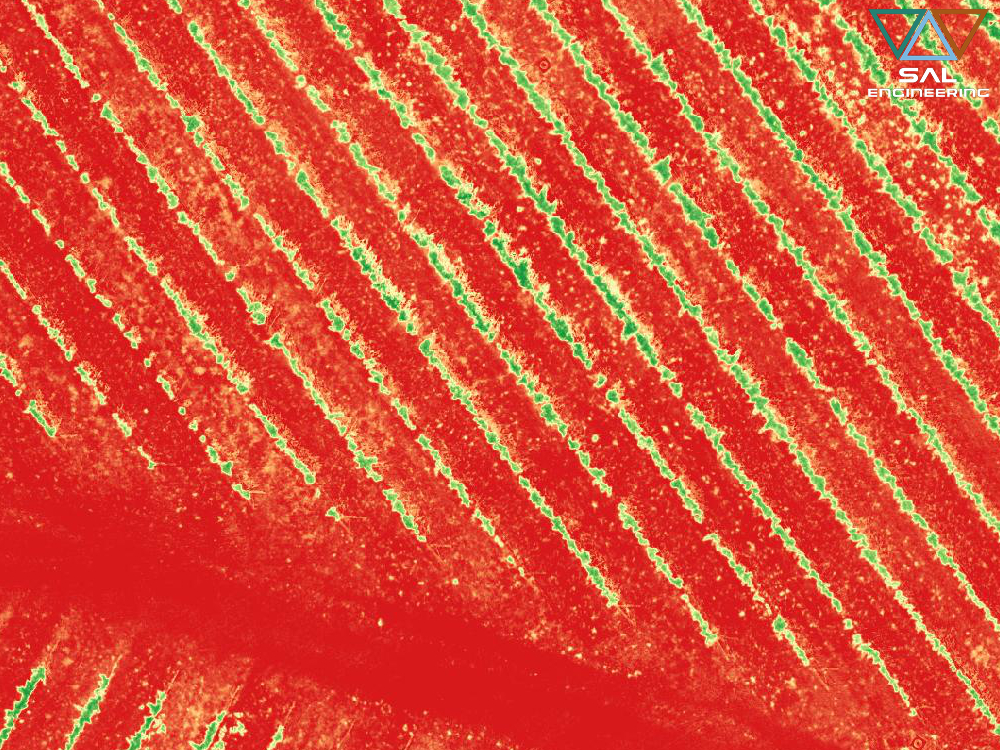
In Tenuta Dodici, Massa Marittima (Grosseto), Italy, SAL Engineering conducted a multispectral survey with MAIA, aimed to create a multispectral orthophoto with 8 different spectral bands. We generate orthophoto in Coastal, Blue, Green, Red, Red Edge, NIR1 and NIR2 band, and we give these products to the agronomists for different kind of use. Here below you can view the bands used for evaluating the vegetation health status after particular treatments on soil and vineyards:

The vineyards present high variability in their biophysical properties, and the many factors that define them can be classified as “static”, such as climate and some properties that describe soil properties (eg weaving, pH, carbonate content, depth, etc …), and “dynamic”, such as the thermal and water values of the soil, the nutrient content and the annual climatic trend. From this, it is clear that the fundamental question on achieving predetermined results is the need to measure the variability.

Today’s viticulture agronomy has to deal with soil management, irrigation, pruning, fertilization, plant protection and harvesting with procedures not only designed and implemented for whole vineyards but also for individual portions within the same vineyard. In viticulture, especially in the hilly area, it frequently occurs that within the same vineyard there are areas characterized by composition, soil structure, presence of humidity, lighting and different microclimate: for these disomogeneities the vine responds accordingly, highlighting particular states of physiological expression. Monitoring vegetative health is a great advantage for small-medium farms to enhance qualitative differences, differentiated agronomic management, and traceability of the product. On the other hand, for larger companies, production estimates are important for the evaluation of grape harvesting, for treatment management, and for traceability of the supply chain.

Vegetative health is the most obvious of these responses. Knowing the health status, vigor, and physiological needs of vines belonging to different vineyard areas will surely help the agronomist to put in place the most appropriate procedures and treatments to ensure a quality harvest. And the first step towards in-depth knowledge of your vineyard is monitoring with multispectral survey techniques to constantly investigate the state of health of the crop. Remote sensing is the set of techniques and methodologies for capturing and interpreting objects and phenomena data based on emitted, reflected and transmitted electromagnetic energy that interact with the surfaces of interest. The percentage of the radiant energy flow incident on a body that is reflected, defined as spectral reflection, is a function of the geometric characteristics and the physical-chemical composition of the body itself, with the consequence that certain objects or surfaces are recognizable in the different bands, for its characteristic spectral signature. It is possible to identify the spectral signature of different substances in specific spectral bands and above all the different types of vegetation in different evolutionary and health states. For example, water tends to lower the reflection of the bodies that contain it, while chlorophyll content proportionally determines the absorption of radiation in the spectral range of red and a high reflection in the near infrared interval.

Airplanes and drones are specially designed to accommodate the multispectral and hyperspectral sensors in their gimbal, in order to carry out the survey with rigorous acquisition procedures, considering the calibration of the sensor according to the light conditions in the moment of the relief, and planning a proper geometry of acquisition. Fundamental in this respect is the integration between the acquisition system, the inertial platform of the aircraft and the Global Navigation Satellite System (GNSS), which enable you to obtain the orientation and position in the space of images captured on the various spectral bands, which allow the flight through photogrammetric overlays.

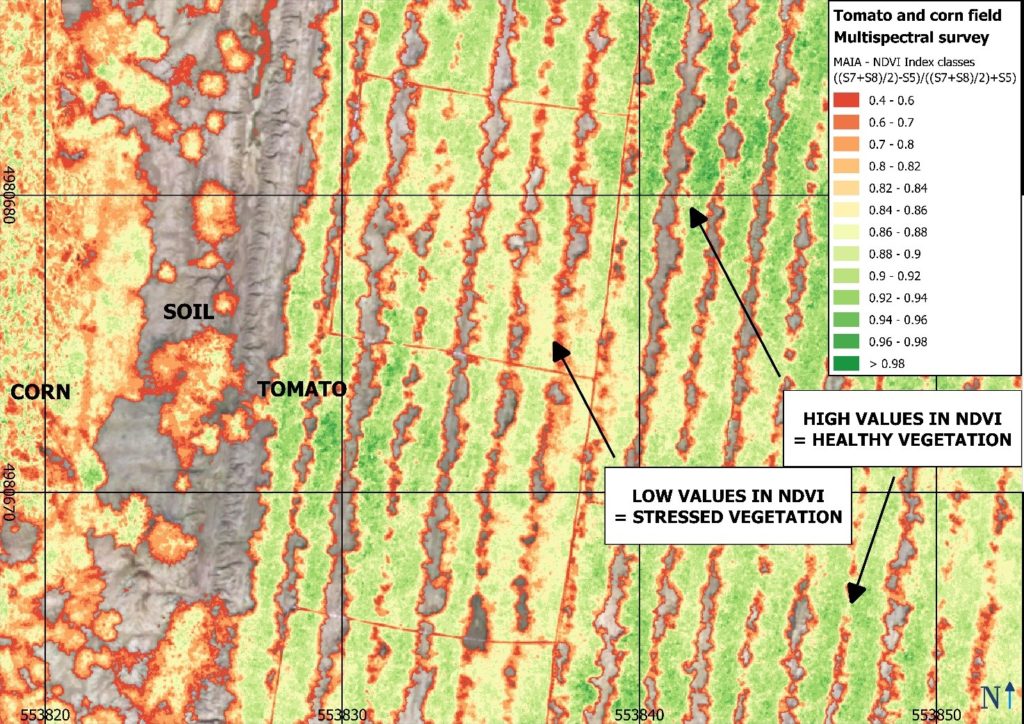
The multispectral orthophoto is the preliminary product, derived from the creation of the georeferenced 3D model of the area, fundamental for the creation of various indices to evaluate the health status of the vineyard vegetation and to decide then where to intervene with fertilizers, other products or agronomic treatments. From multispectral data, it is possible to obtain a series of indexes capable of describing precisely the characteristics of the vegetation present on the soil. Among these vegetation indices, the best known is the Normalized Difference Vegetation Index (NDVI), which is based on a normalized difference between the near and red infrared bands. As evidenced by countless studies, the NDVI proves very reliable in describing the magnitude of photosynthetic active biomass present on the investigated surface. The NDVI index is in fact correlated positively with the amount of plant biomass per unit of surface (LAI, leaf area index) and, therefore, the vigor of culture. The index assumes values between +1 and -1: in particular, from 0.1 to 0.3 we usually find a naked or slightly inert soil, while in the case of plant biomass there is an index higher than 0.5, and it increases to identify a different vegetative state of the plant, and an increasing production of chlorophyll. The contribution of specific vegetative indices to viticulture has been extensively studied and demonstrated, but it should be remembered that other interesting thematic maps for viticulturists can cover crop yields, acidity, sugars, polyphenols, anthocyanins, etc.

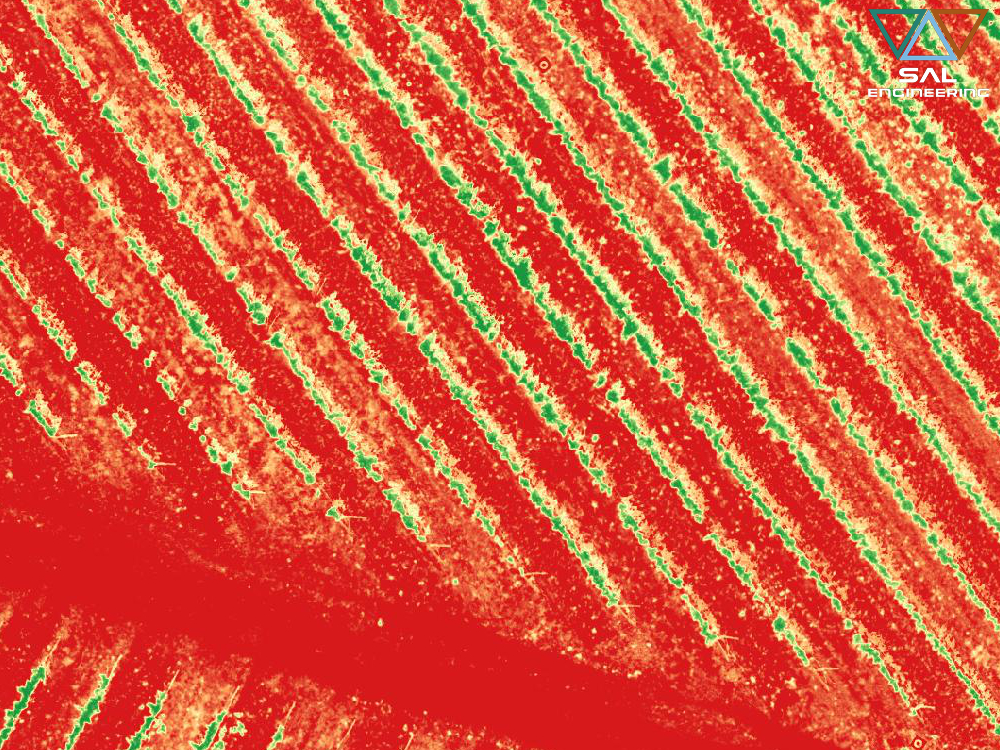
Here below you can view the same portion of vineyard in different indexes and views calculated on the raster products shown above:

The strategic goal of precision viticulture is to know the vineyard in the detail of the individual plant and to adapt cultivation techniques to its specific needs.

Once collected, data must be evaluated and interpreted through agronomic technical advice. GIS software for spatial data processing and analysis is currently used in professional practice and in viticulture research activities: vegetative health maps can be used to make picking choices in a vineyard or in a large area.

An ever-increasing integration of the collected data and an increasing accuracy and precision of the data that can be obtained allows:

  • a faster and more accurate plantation of new vineyards;

  • a reasoned and “environmentally friendly” management of the vineyard;

  • significant saving of time and material;

  • a reduction in intervention in the vineyard;

  • synergistic control of the vineyard-cellar chain;

  • improving the quality of grapes and wine;

  • operation and site-specific machining.


    Vineyards present high variability in their biophysical properties, and the many factors that define them can be classified as “static”, such as climate and some properties that describe soil properties (eg weaving, pH, carbonate content, depth, etc …), and “dynamic”, such as the thermal and water values of the soil, the nutrient content and the annual climatic trend. From this, it is clear that the fundamental question on achieving predetermined results is the need to measure the variability.


    Multispectral survey is the fundamental tool for having agronomic knowledge of the agricultural resource because it allows a series of comparisons between the vegetative health conditions of the crop:

    • in the different vegetative stages expected during the seasons;

    • before treatment for targeted intervention;

    • after treatment for an assessment of the consequences;

    • in different plots to understand different reactions to equal interventions;

    • in different seasons to monitor growth and health.


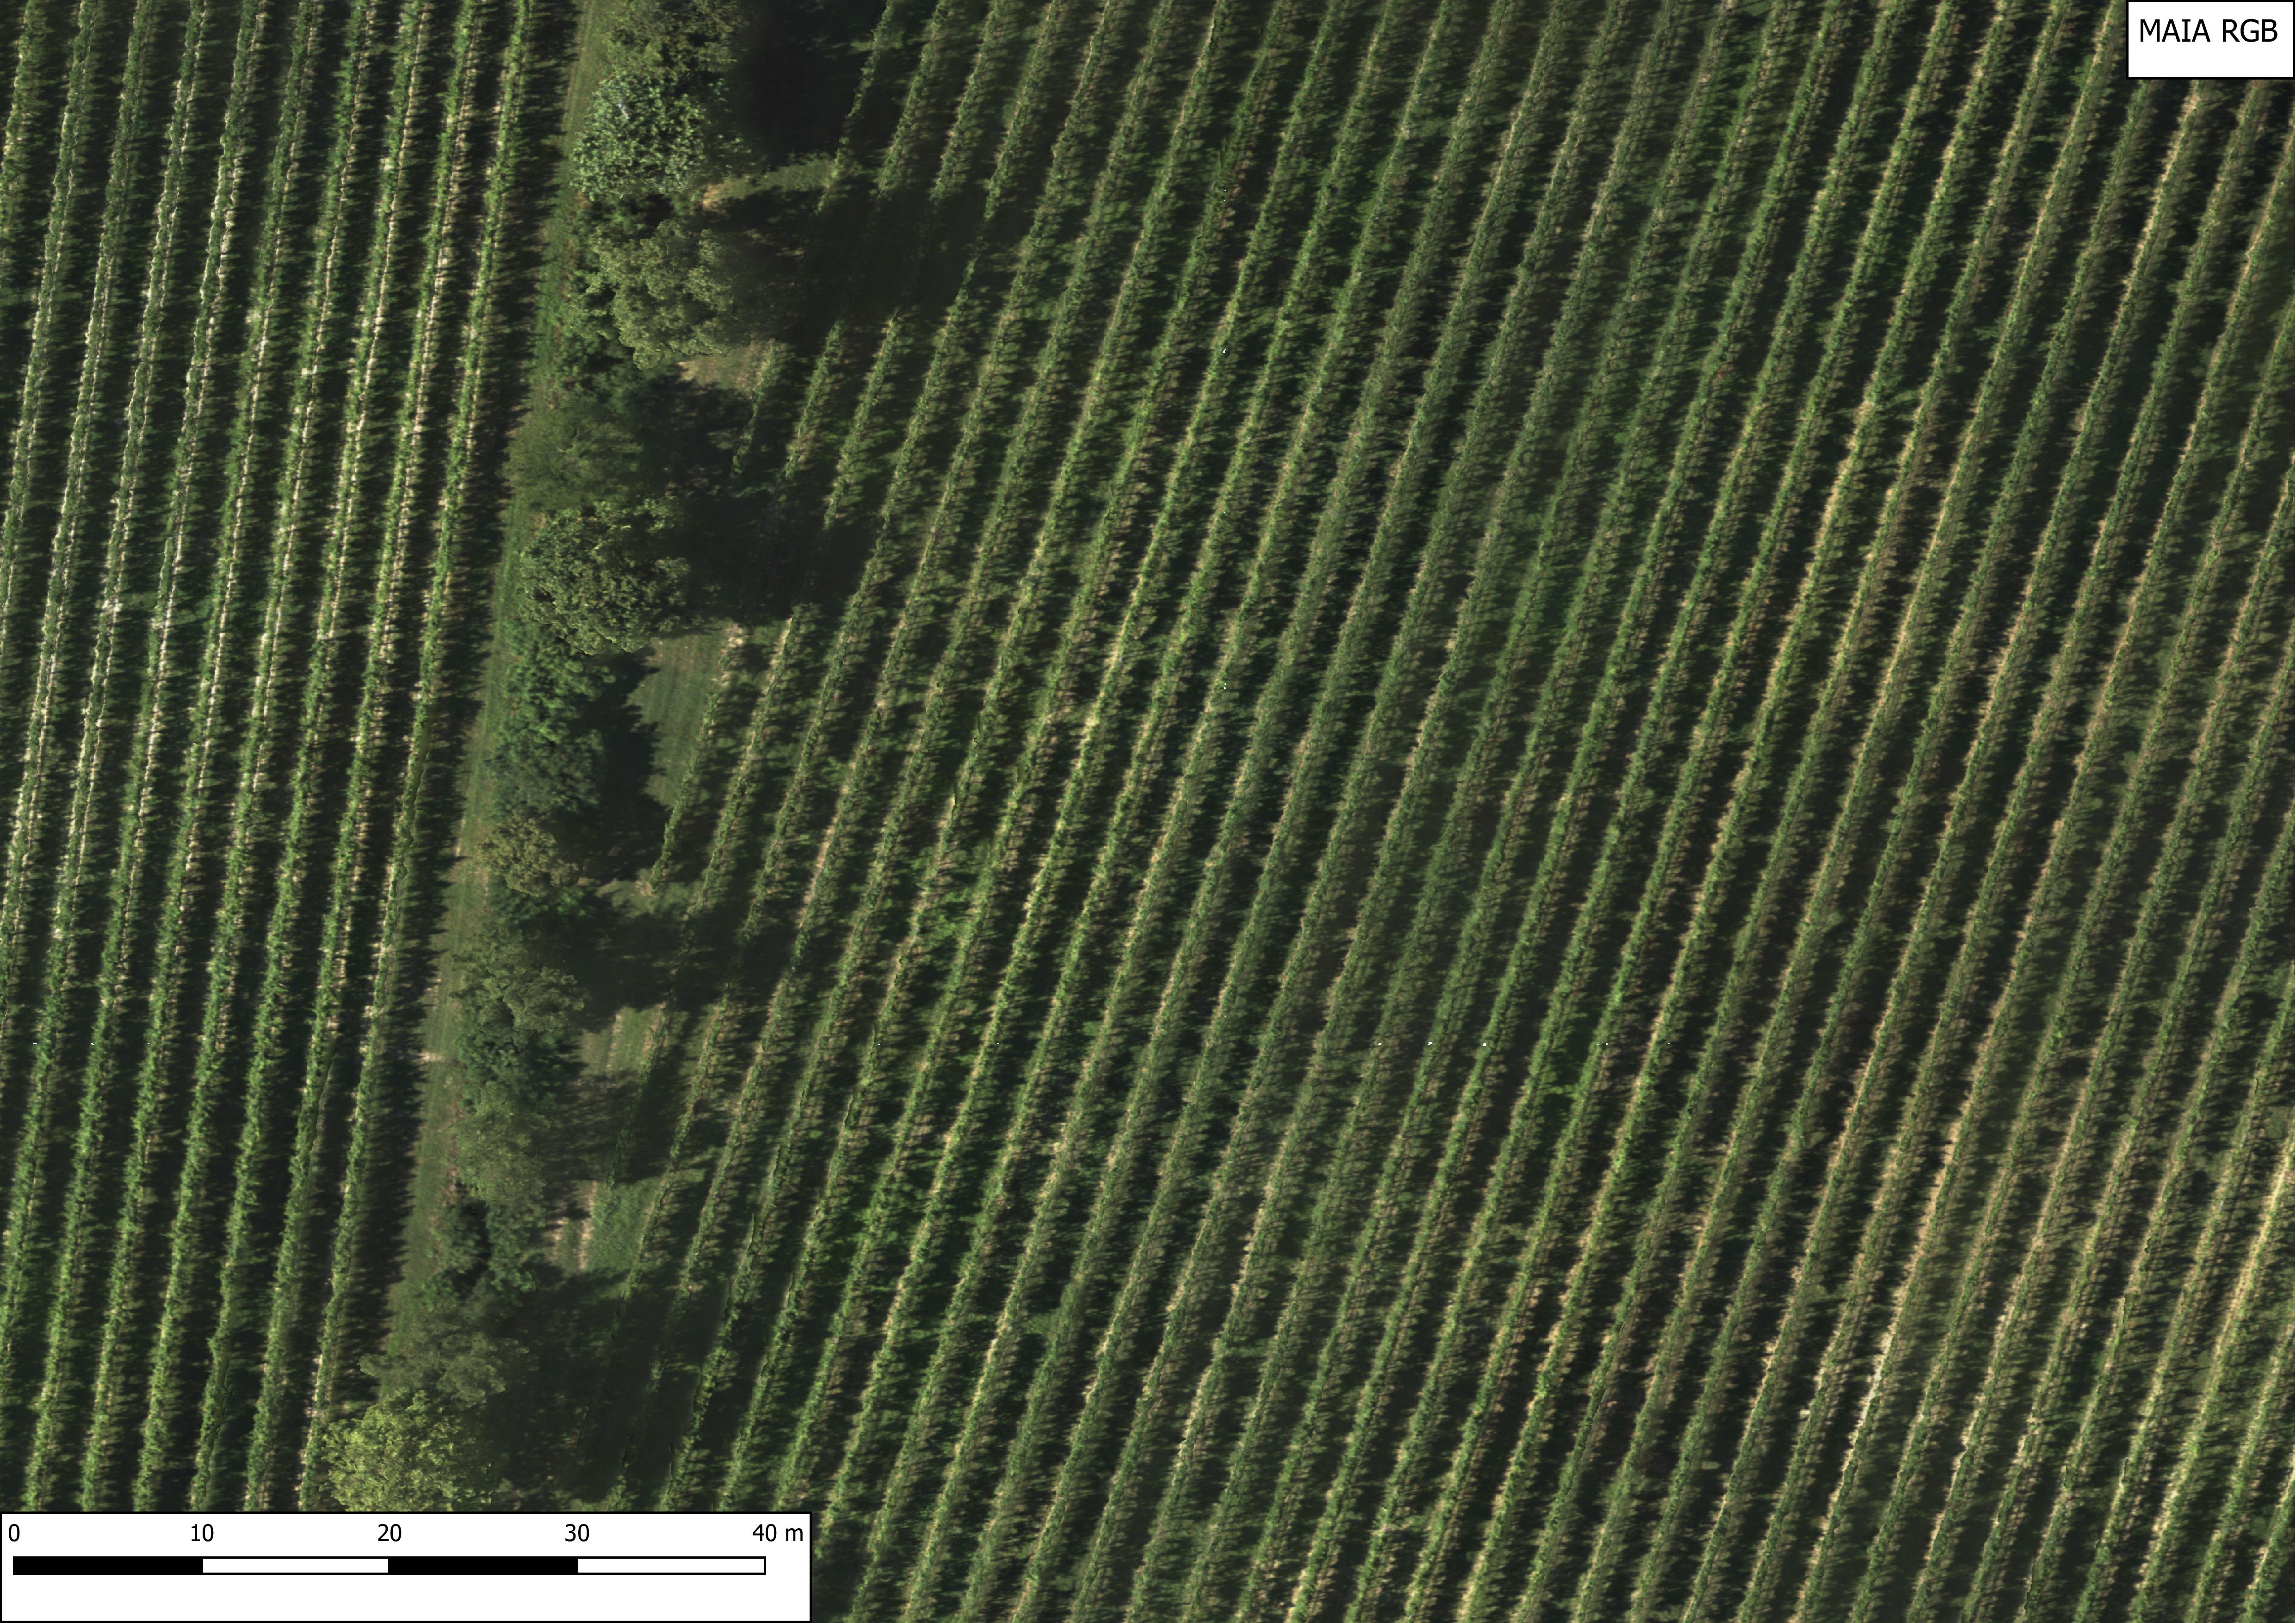
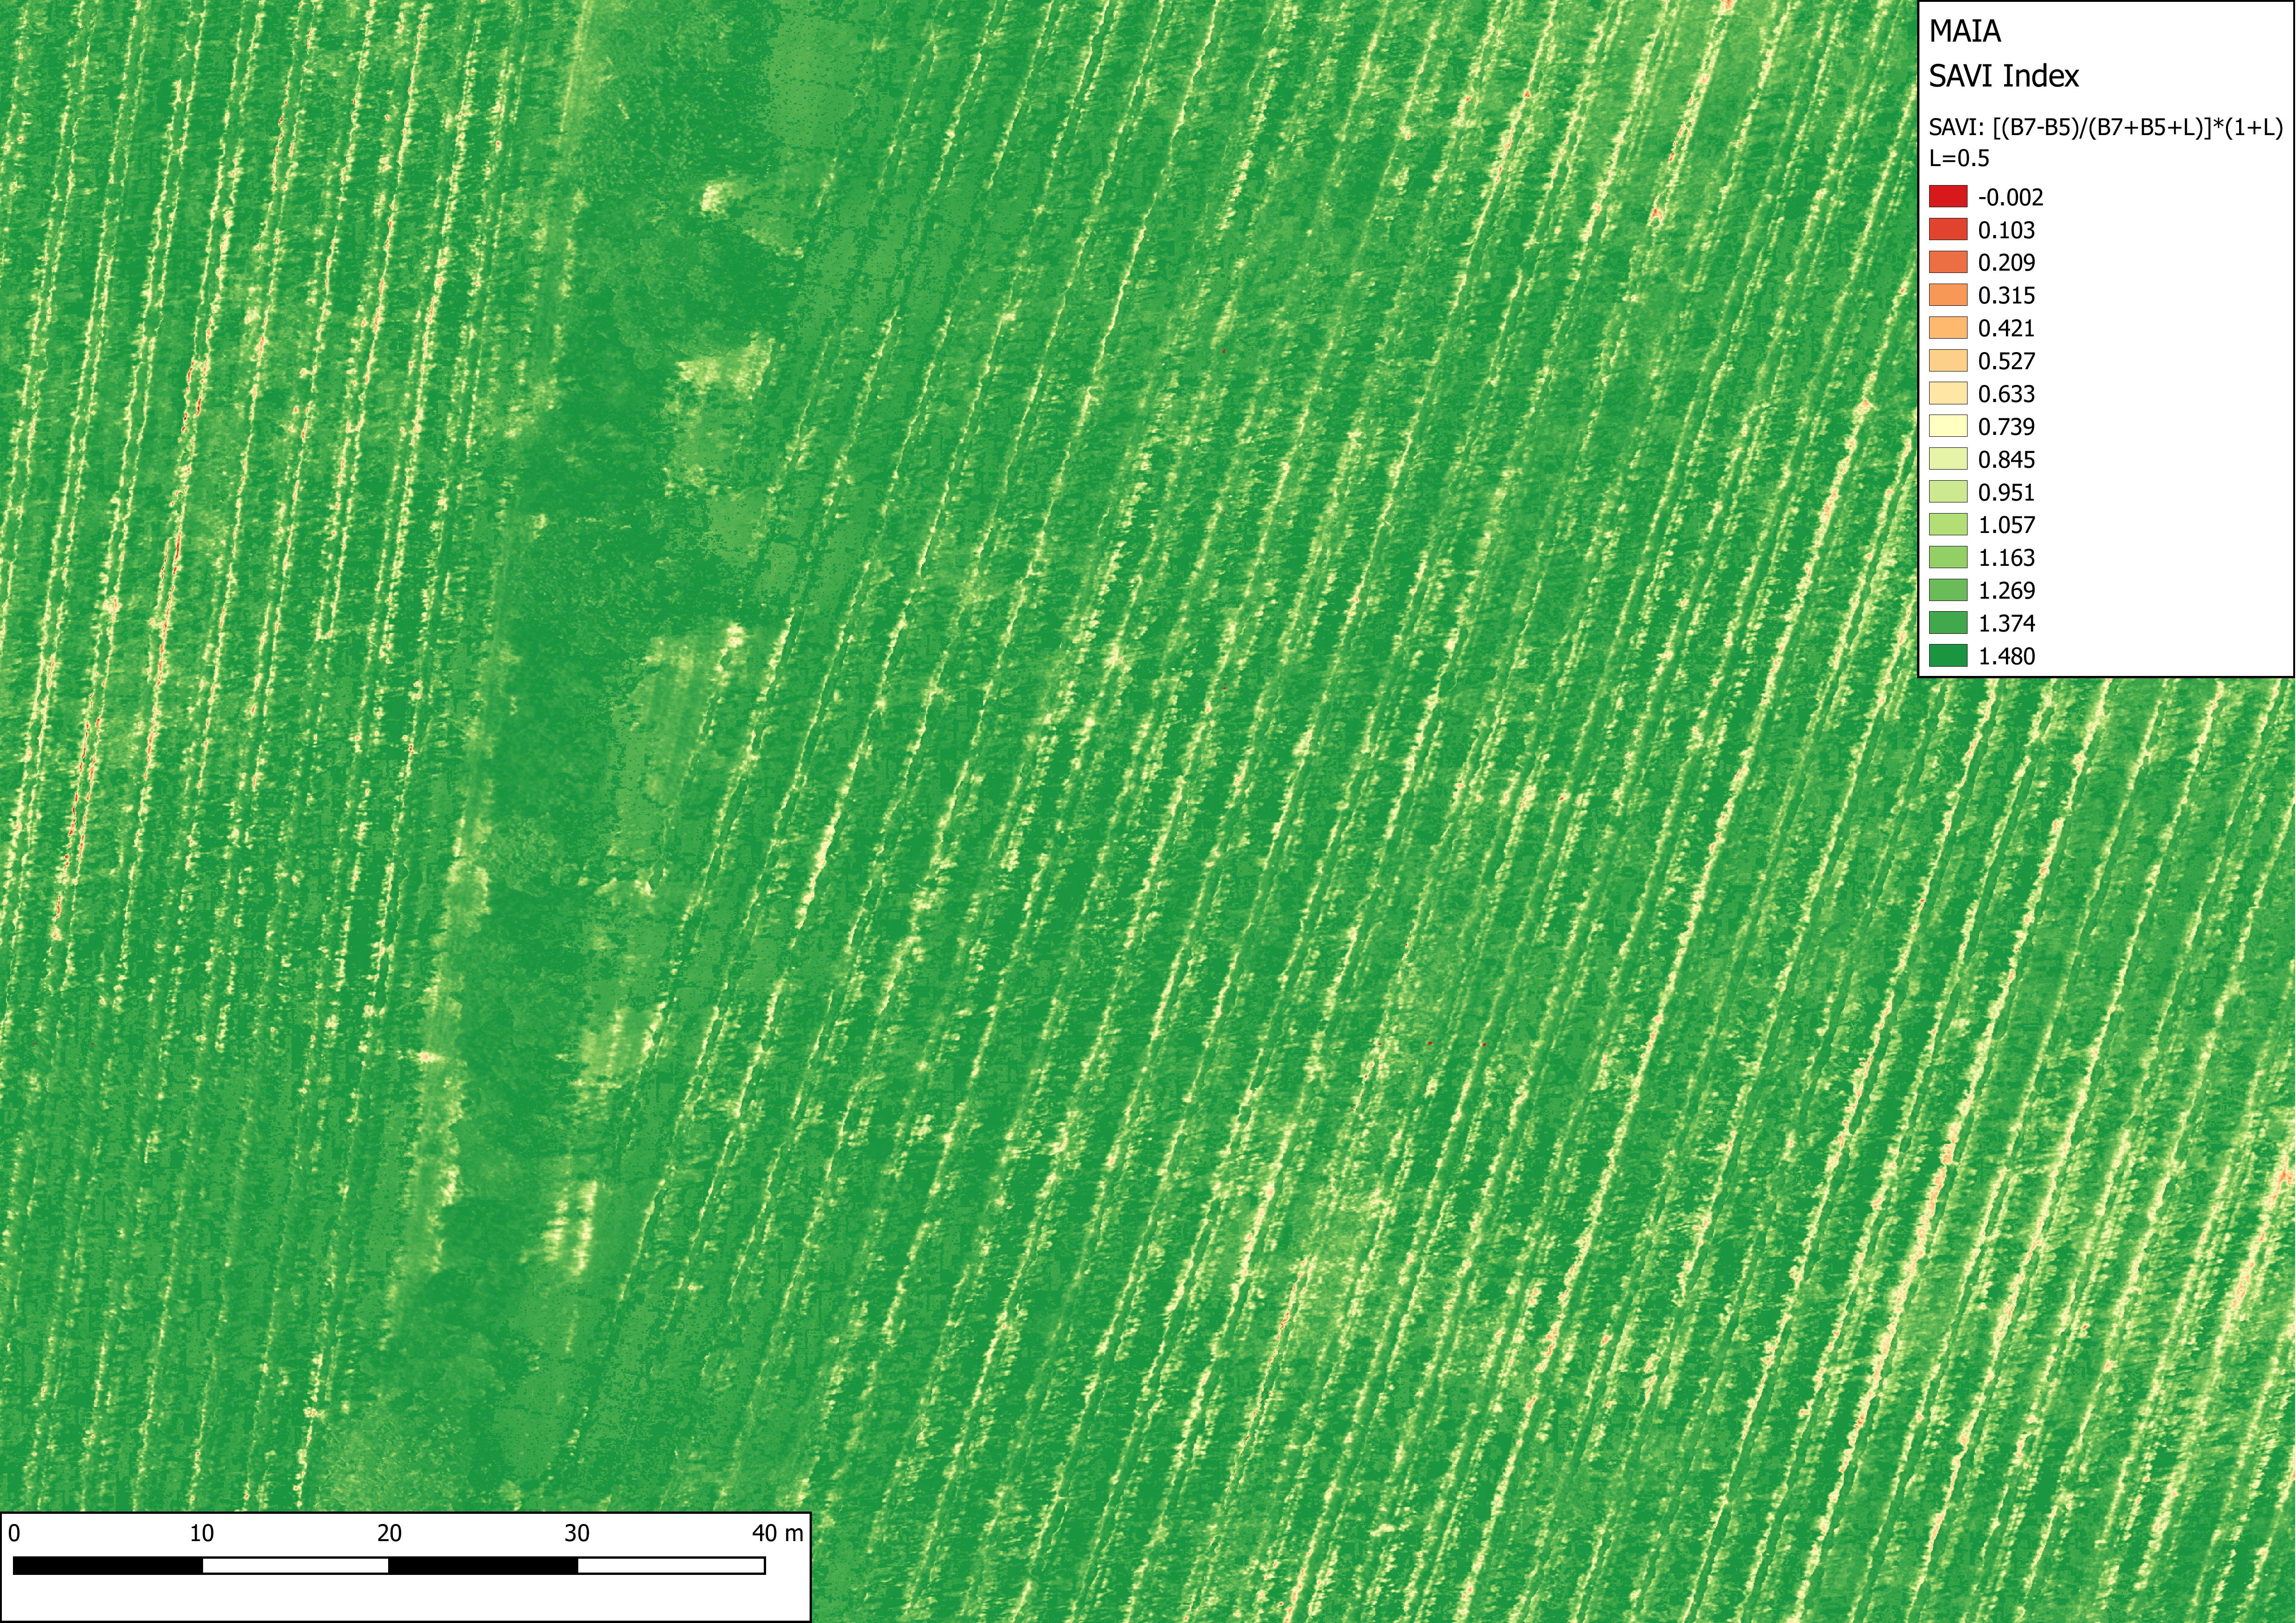
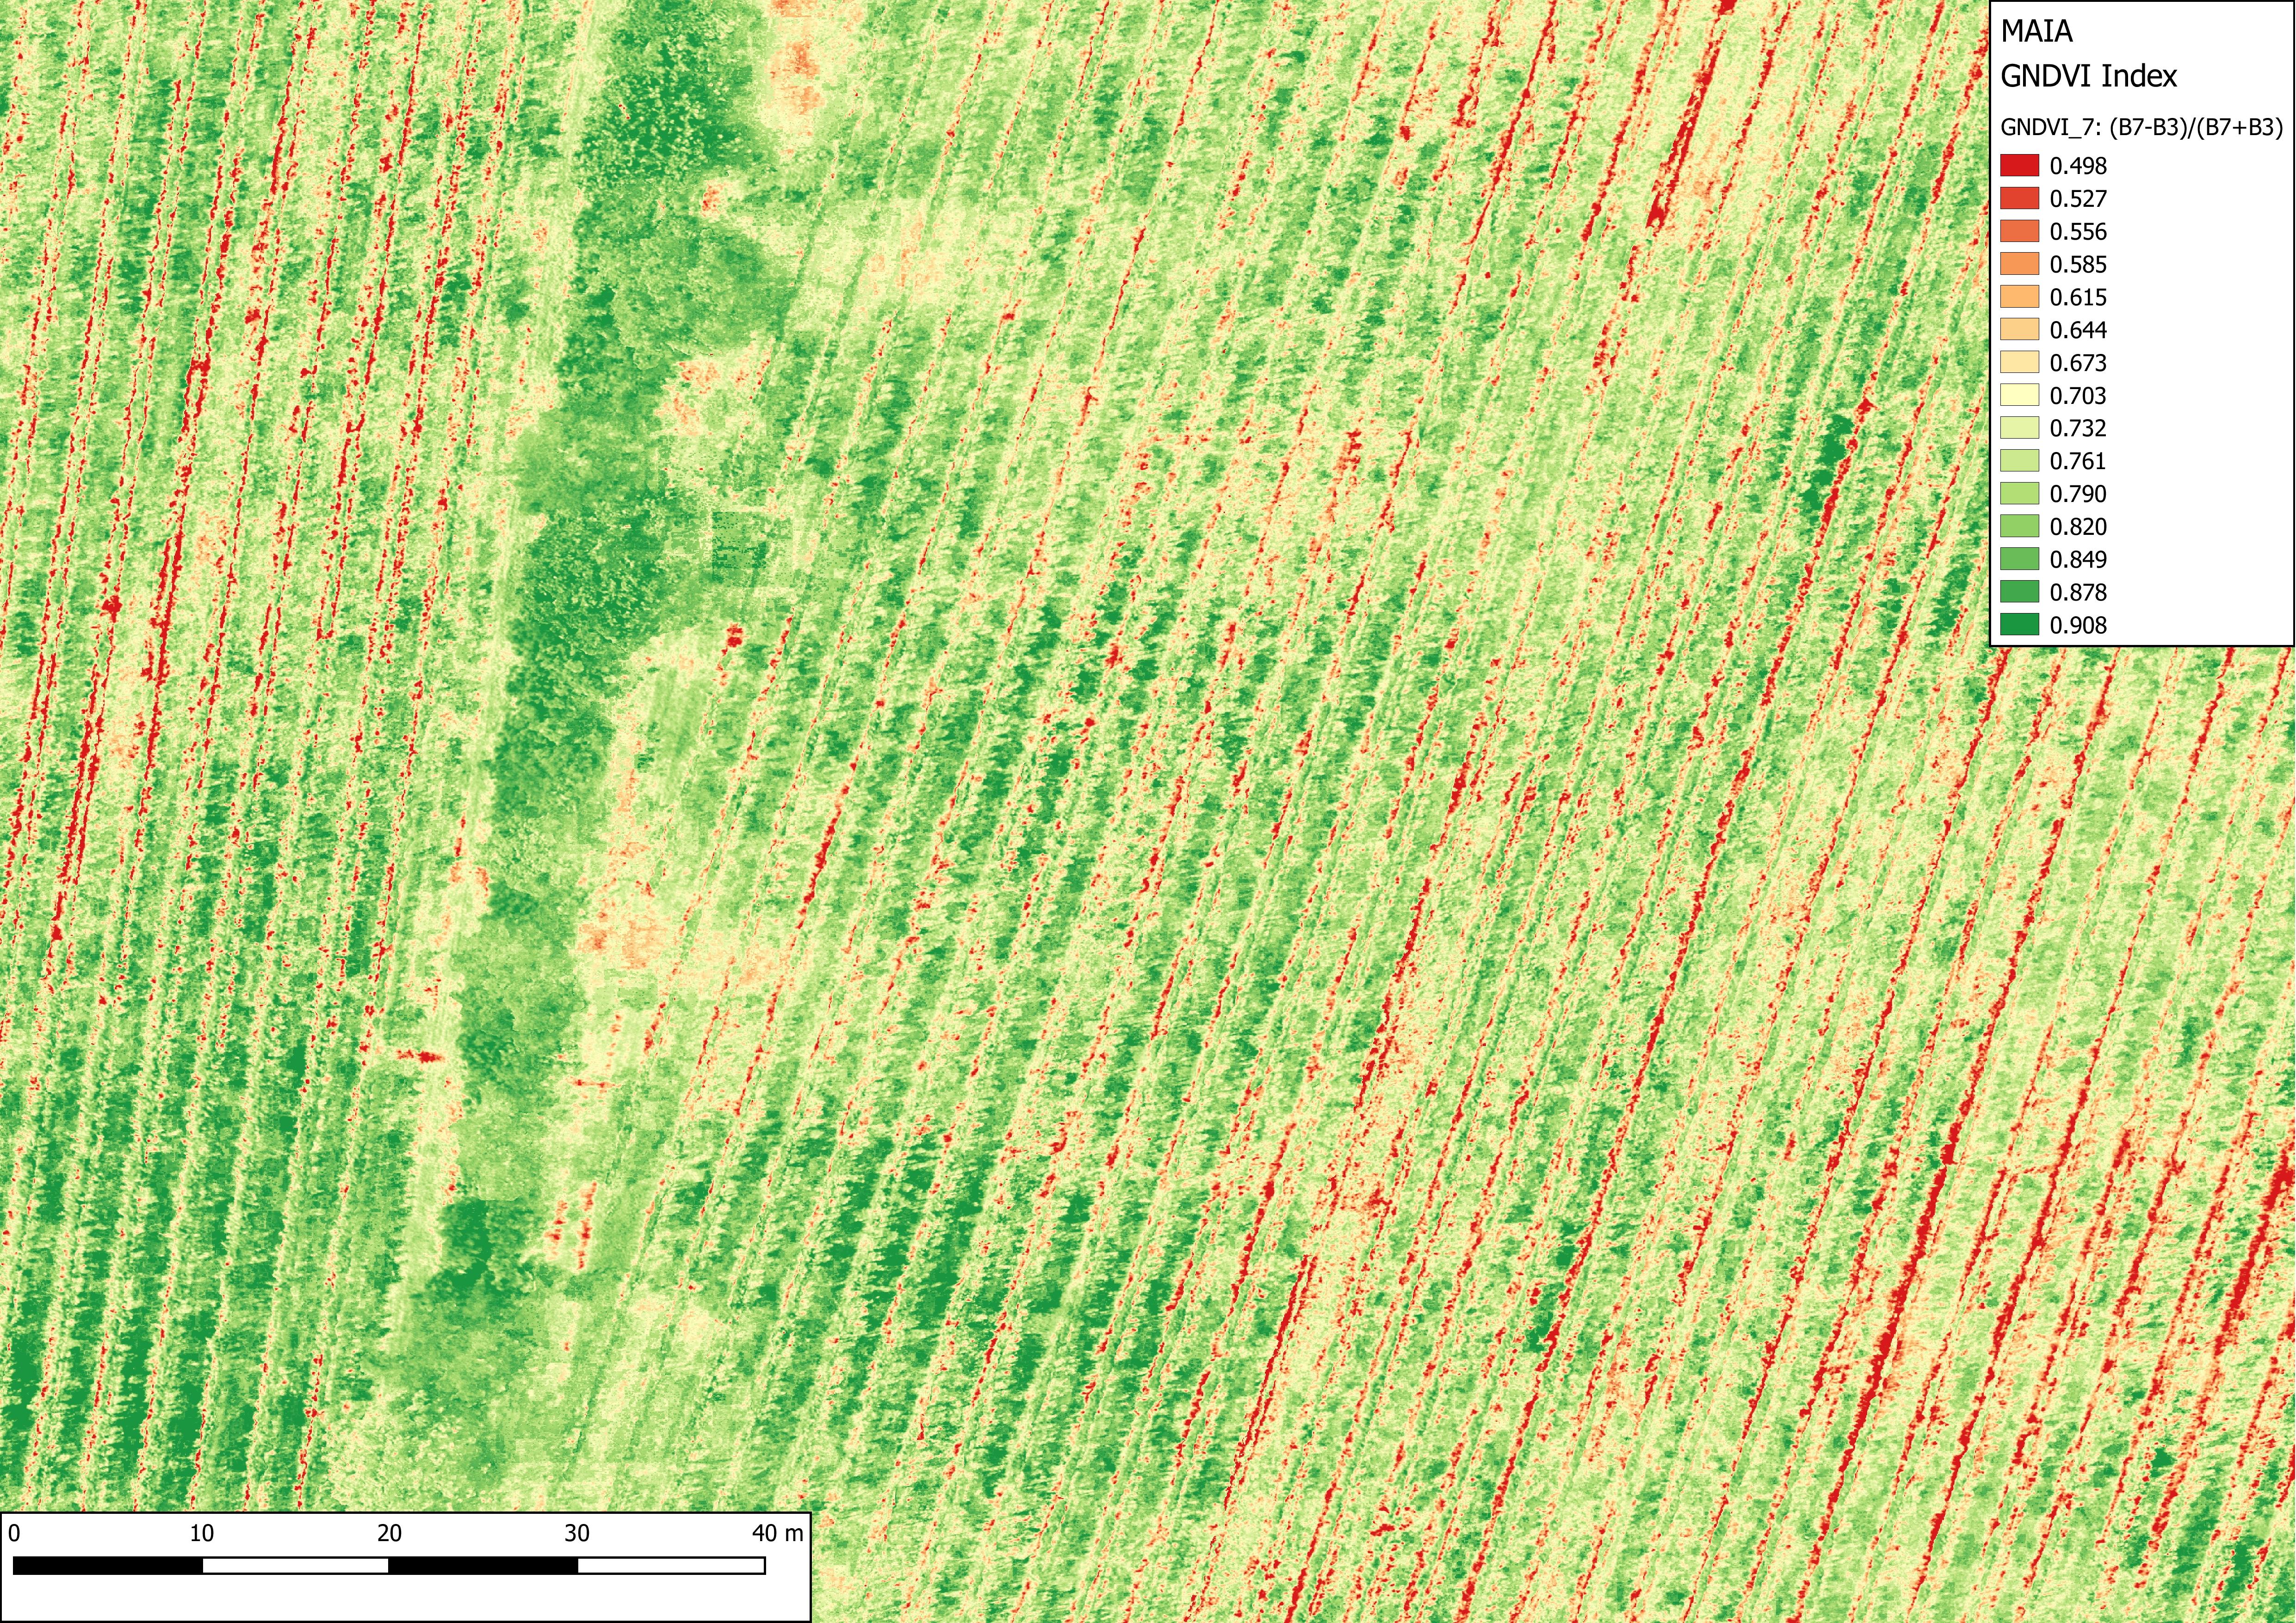
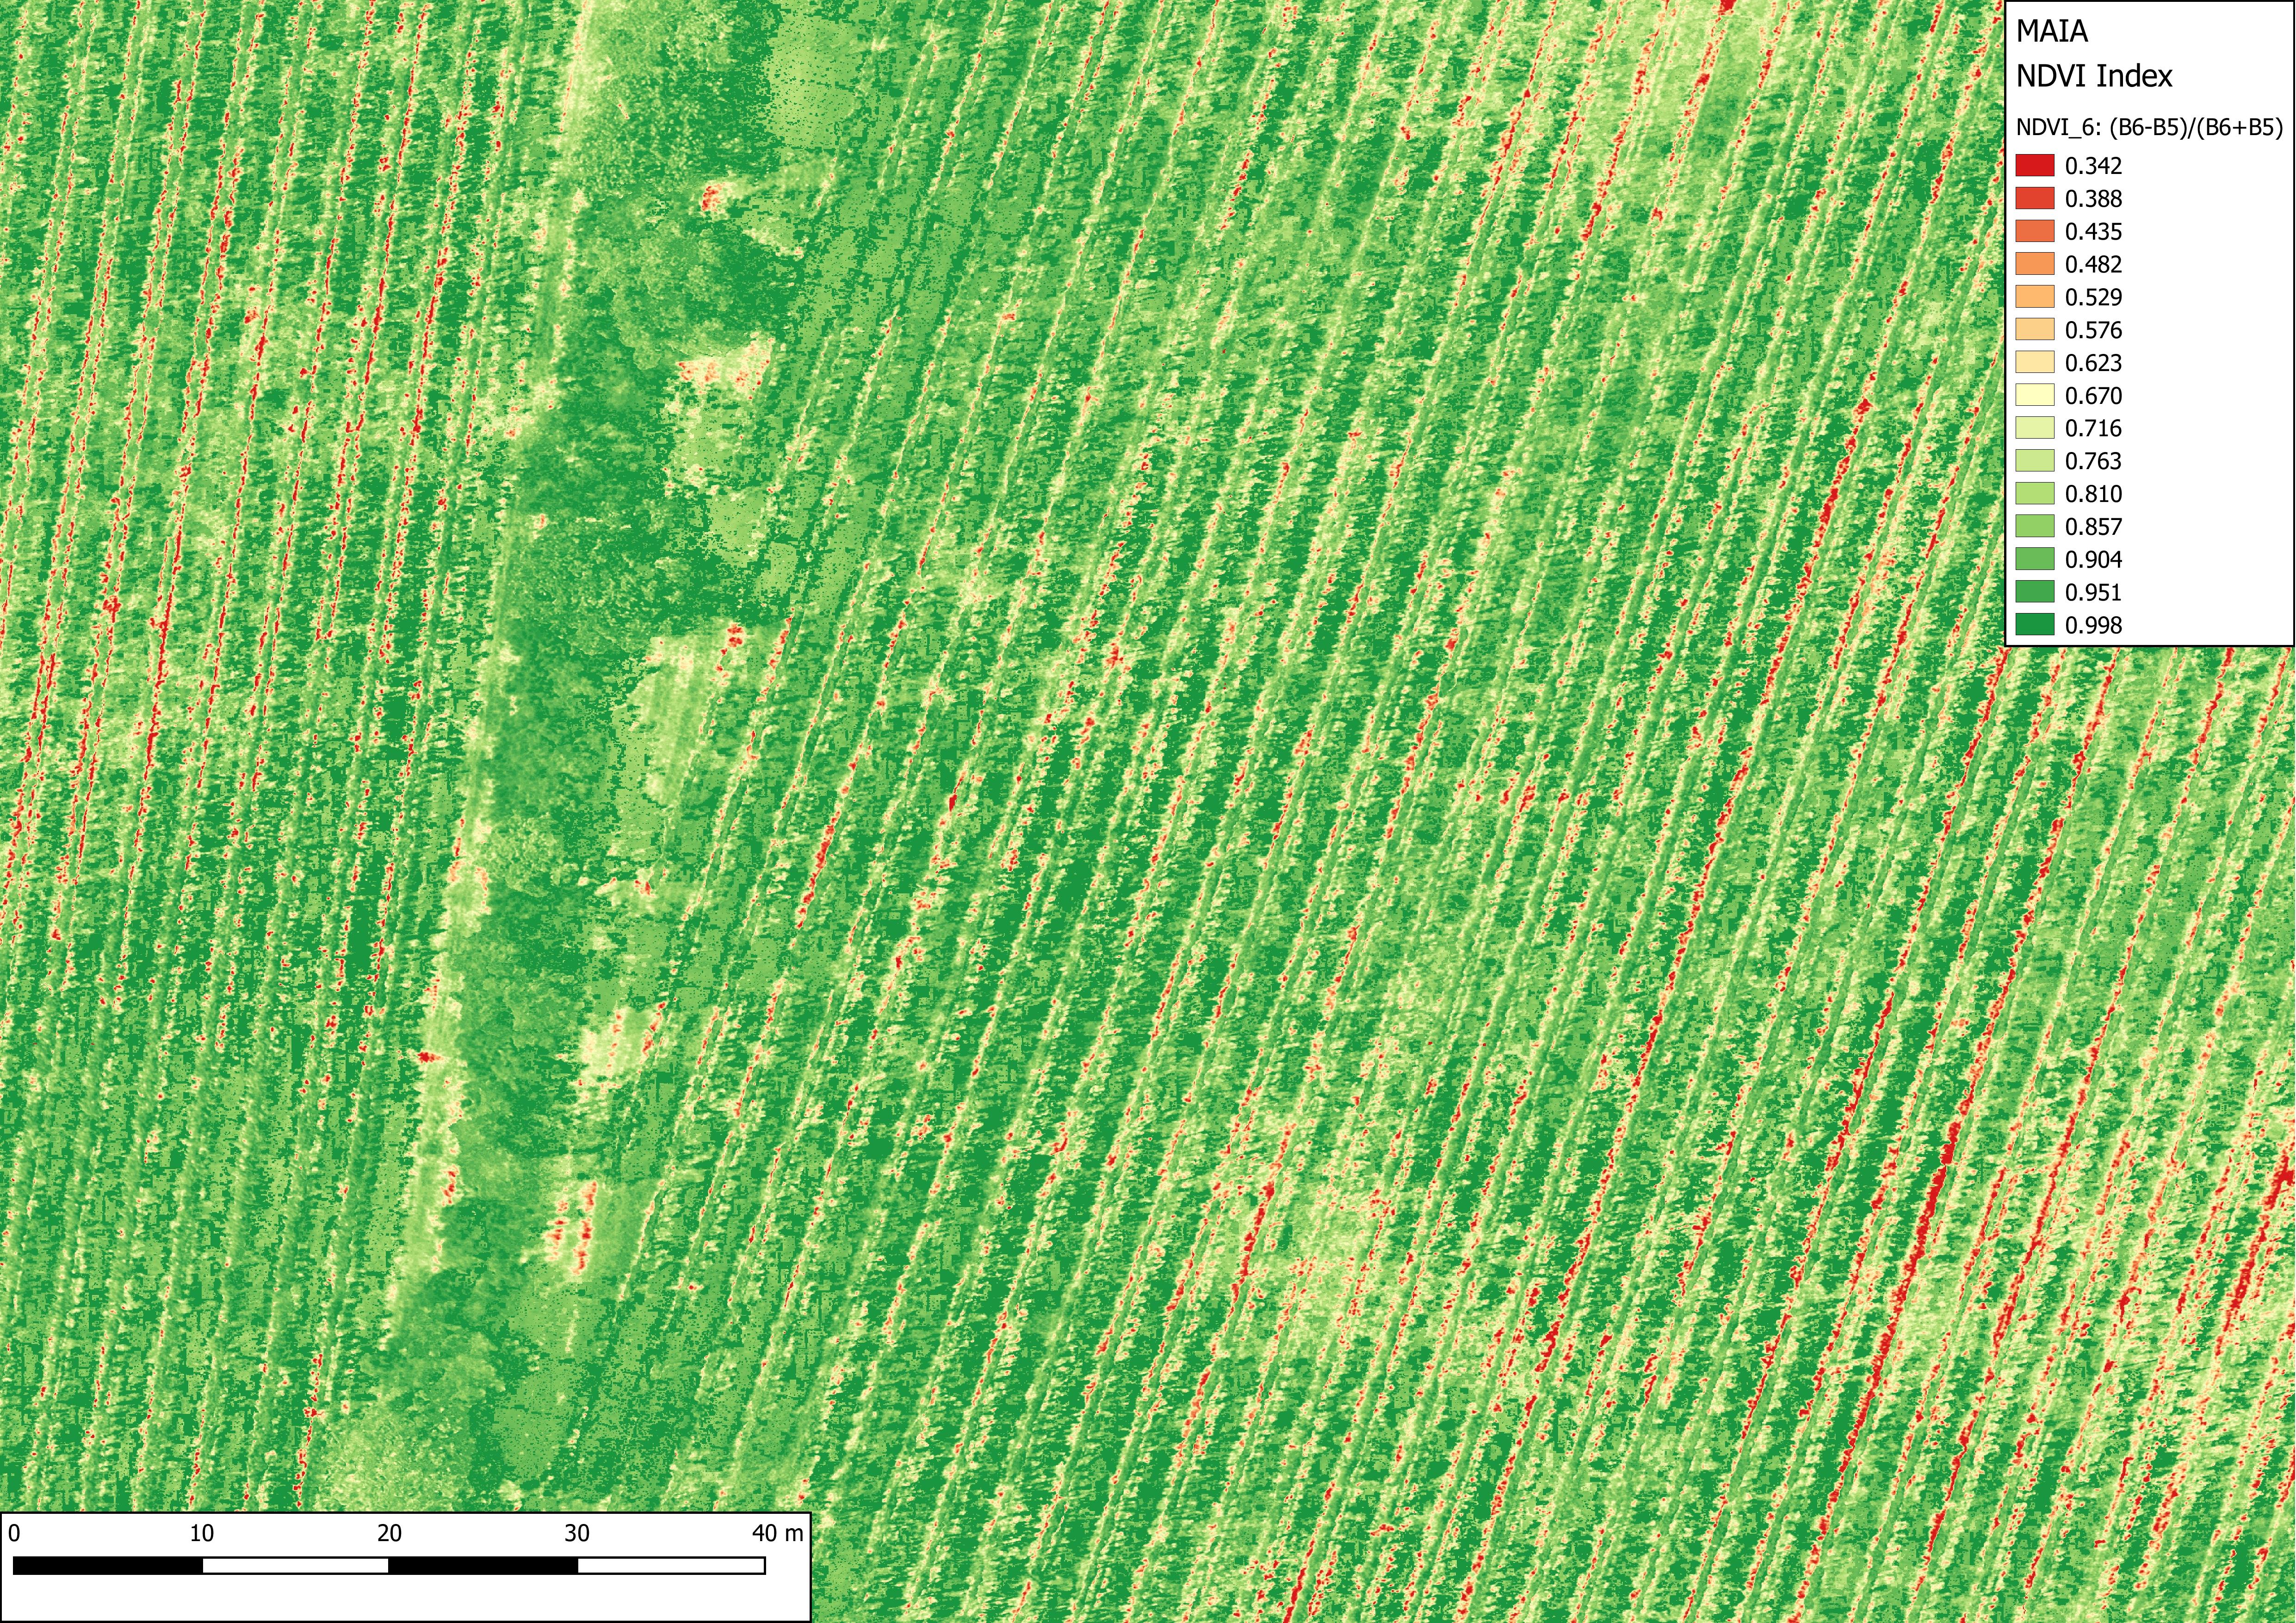
    At last, here below you can view the same portion of a Franciacorta vineyard in a part of orthophoto mapped in RGB and in different indexes:

    From multispectral data, it is possible to obtain a series of indexes capable of describing precisely the characteristics of the vegetation present on the soil. Among these vegetation indices, the best known is the Normalized Difference Vegetation Index (NDVI), which is based on a normalized difference between the near and red infrared bands. As evidenced by countless studies, the NDVI proves very reliable in describing the magnitude of photosynthetic active biomass present on the investigated surface. The NDVI index is in fact correlated positively with the amount of plant biomass per unit of surface (LAI, leaf area index) and, therefore, the vigor of culture. The index assumes values between +1 and -1: in particular, from 0.1 to 0.3 we usually find a naked or slightly inert soil, while in the case of plant biomass there is an index higher than 0.5, and it increases to identify a different vegetative state of the plant, and an increasing production of chlorophyll.

    The contribution of specific vegetative indices to viticulture has been extensively studied and demonstrated, but it should be remembered that other interesting thematic maps for viticulturists can cover crop yields, acidity, sugars, polyphenols, anthocyanins.